Integrating ESG in Portfolio Construction
- Roy Henriksson, Joshua Livnat, Patrick Pfeifer, and Margaret Stumpp
- Journal of Portfolio Management
- A version of this paper can be found here
- Want to read our summaries of academic finance papers? Check out our Academic Research Insight category
What are the research questions?
- Is it possible to identify good and bad ESG firms when they do not report sufficient ESG data items?
- How does that compare to a selection approach that uses all ESG data items vs. only Material ESG items (only those relevant to the firm’s industry).
What are the Academic Insights?
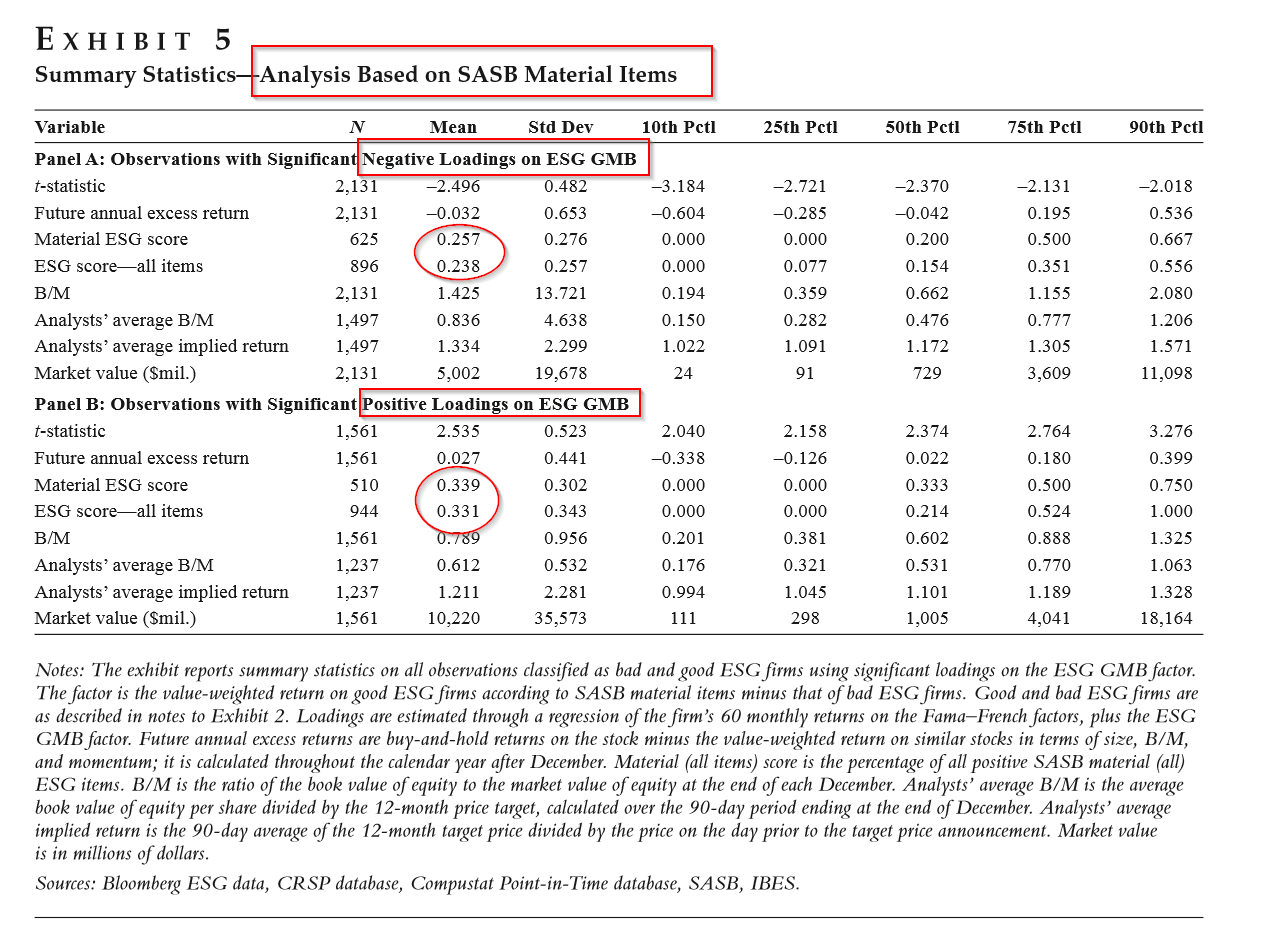
- YES. Using an adaptation of the Fama-French methodology, the authors construct an ESG factor using of the returns from a long/short portfolio of G(ood) ESG minus B(ad) ESG stocks, or GMB. Exposures to the GMB factor are estimated from the monthly return series in a regression that also includes the FF factors. A positive sign on GMB indicates a “good” ESG firm. A negative sign indicates a “bad” ESG firm, even if those stocks have not disclosed the necessary ESG information.
- SIMILAR. The set of firms with positive exposure on GMB (Panel A, Exhibit 5) is 0.238 for Material ESG items vs. 0.257 for All ESG items. The set of firms with a negative exposure on GMB is .339 (Panel B, Exhibit 5) for Material items vs. .331 (Panel B, Exhibit 5) for All items. The similarity of the results of firms with valid ESG data to the GMB exposures indicates the potential to be gained by expanding the universe as illustrated. Bad ESG firms produced an average excess return of 3.2% (Panel A, Exhibit 5) vs. 2.7% for Good ESG firms, again a significant difference. This difference was not sustained when longer investment horizons were considered. Year by year results varied between outperformance and underperformance for the 2 ESG groups.
Why does it matter?
The number of firms that fail to report material ESG items is very large. The methodology described and tested in this paper is designed to expand the classification of firms into good and bad ESG exposures when the required ESG items are not reported. Using only firms with a significant exposure (see t-stats), the results represent a substantial increase, in the vicinity of 200%, in observations to be classified even though many firms do not report a sufficient number of Material or even any ESG items. The results were robust to the scores firms received when reporting a sufficient number of Material items, as well as any ESG items, and then compared to the GMB factor exposures.
ONE CAVEAT: The data only covered the period 2008 to 2015. Although the time frame is a limitation, the approach presented here is clever.
The most important chart from the paper

Abstract
This study recommends an approach to integrate ESG into portfolios that is based on two premises. The first is that classifying firms into good and bad ESG companies should be performed using ESG items that are material in that industry. The second premise is that it is possible to overcome the sparse voluntary ESG data reported by firms by constructing an ESG Good Minus Bad (GMB) factor, and then finding those firms whose returns load significantly on this factor. We provide evidence that shows the superiority of using material industry-specificESG items, and the merits of expanding the ESG classification using the ESG GMB loadings. Our approach is particularly suitable for quantitative investment approaches which invest in portfolios with large number of positions and many small active exposures, where vendor ESG data can be used in portfolio construction efficiently without the need to employ detailed ESG analyses of many individual firms. With such portfolios, it is less about the ESG classification of an individual company and all about the aggregate portfolio tilt towards good ESG and away from bad ESG at the portfolio level.
About the Author: Tommi Johnsen, PhD
—
Important Disclosures
For informational and educational purposes only and should not be construed as specific investment, accounting, legal, or tax advice. Certain information is deemed to be reliable, but its accuracy and completeness cannot be guaranteed. Third party information may become outdated or otherwise superseded without notice. Neither the Securities and Exchange Commission (SEC) nor any other federal or state agency has approved, determined the accuracy, or confirmed the adequacy of this article.
The views and opinions expressed herein are those of the author and do not necessarily reflect the views of Alpha Architect, its affiliates or its employees. Our full disclosures are available here. Definitions of common statistics used in our analysis are available here (towards the bottom).
Join thousands of other readers and subscribe to our blog.

