Fact, Fiction and the Size Effect
- Ron Alquist, Ronen Israel, And Tobias Moskowitz
- Journal of Portfolio Management, 2018
- A version of this paper can be found here
- Want to read our summaries of academic finance papers? Check out our Academic Research Insight category
What are the Research Questions?
The size effect is the phenomenon in which small stocks (i.e., those with lower market capitalizations), on average, outperform large stocks (i.e., those with higher market caps) over time. The size effect was first documented by several academic papers in the early 1980s ( Banz, 1981). However, it remains one of the most debated market anomalies among scholars. See here, here, and here some discussion on the topic.
Some of the research questions investigated by the authors are the following:
- Is the size effect a strong documented factor?
- Has the size effect disappeared or weakened since its discovery?
- Does the size effect work in equity markets outside the US?
- Does the size effect mostly come from micro-caps?
What are the Academic Insights?
- NO- Based on the authors research, if Banz’s paper had been written today, and using Harvey, Liu, and Zhu’s (2016) and Harvey’s (2017) suggested threshold value of 3.0 for the data-mining robust t-statistic, the statistical evidence for a size effect would be even weaker than already originally presented. The size effect is not particularly strong (especially if compared with its cousins value and momentum), even over the original sample period in which it was discovered.
- YES- Since the many publications on the size effect, there has been no significant positive premium associated with small-cap strategies.
- NO- The authors study the size effect in 24 international equity markets and find no consistent evidence of a positive size premium.
- YES- To the extent there is a premium for small stocks, the premium does indeed appear to be concentrated among the tiniest 5% of firms.
Why does it matter?
The authors find neither strong empirical evidence nor robust theoretical support for a prominent size premium. This raises the question: Should academic and investors be using a size-based factor? The authors suggest that, “It depends.” For example, their evidence suggests that the success of some other factors, such as value, among small-cap equities implies being overweight those firms will enhance returns, assuming the higher transaction costs of such a strategy don’t destroy any potential benefits.
The Most Important Chart from the Paper
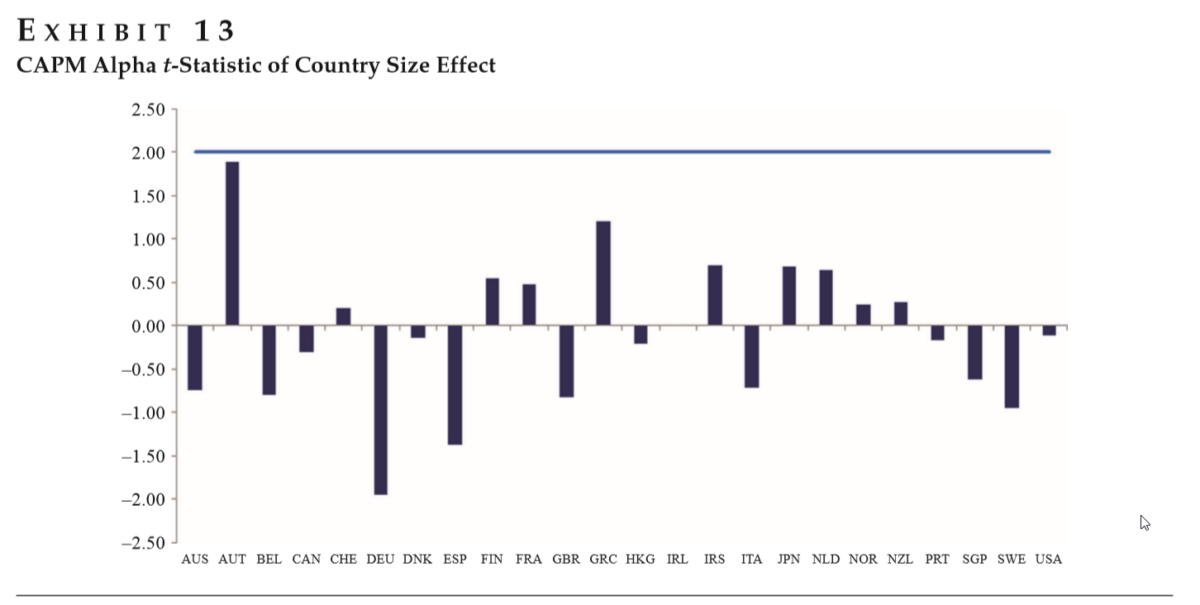
Exhibit 13 plots the t-statistics of the CAPM alphas for each of the 24 countries we examine. As the exhibit shows, none of the t-statistics for the CAPM alphas of the country-level SMB portfolios is statistically significant. (The standard 2.0 threshold for significance for a t-statistic is highlighted).

Abstract
We investigate how distraction affects the trading behavior of professional asset managers. Exploring detailed transaction-level data, we show that managers with a large fraction of portfolio stocks exhibiting an earnings announcement are significantly less likely to trade in other stocks, suggesting that these announcements absorb attention which is missing for the choice of which stocks to trade. Hence, attention constraints can be binding even among this elite group of traders. Finally, we identify two channels through which distraction hurts managers’ performance: distracted managers fail to close losing positions, partly explained by these managers displaying a stronger disposition effect, and incur slightly higher transaction costs.
About the Author: Wesley Gray, PhD
—
Important Disclosures
For informational and educational purposes only and should not be construed as specific investment, accounting, legal, or tax advice. Certain information is deemed to be reliable, but its accuracy and completeness cannot be guaranteed. Third party information may become outdated or otherwise superseded without notice. Neither the Securities and Exchange Commission (SEC) nor any other federal or state agency has approved, determined the accuracy, or confirmed the adequacy of this article.
The views and opinions expressed herein are those of the author and do not necessarily reflect the views of Alpha Architect, its affiliates or its employees. Our full disclosures are available here. Definitions of common statistics used in our analysis are available here (towards the bottom).
Join thousands of other readers and subscribe to our blog.

