Evaluating Spending Policies in a Low Return Environment
- Peng Wang, Laura Chapman, Steven Peterson, and Jon Spinney
- Financial Analyst Journal, Fall 2018
- A version of this paper can be found here
- Want to read our summaries of academic finance papers? Check out our Academic Research Insight category
What are the Research Questions?
Market behavior since the GFC and the subsequent low return environment that we have been coping with poses the question of the sustainability of endowed institutions (endowments, DB pension plans etc.) because the fund’s rate of return and spending rate tend to converge. The theory of endowment management states that investment policy and spending policy are intrinsically linked, but the existing practice of the profession appears to have maintained separation of the two ( Dybvig 1999). Even if endowments are long-term investors, they may be understating the true risk of capital losses in a world in which forward expected returns decline without commensurate declines in spending rates. This situation suggests the need for a reexamination of risk tolerance and volatility targets for these funds and possible changes in their spending policies. The authors study the impact of spending policy on the risk of an endowed institution, particularly in light of investment risk and return.
Specifically, they ask the following research question:
- How should an institution manage its spending policy to help ensure the long-run health of the institution while also minimizing variability in year-over-year payouts?
What are the Academic Insights?
By focusing on on the effects of spending policy, the authors study and compare two different approaches in use today by endowments: the moving-average model (MA) and the snake-in-the-tunnel model (SIT)(1). To compare the two, they use metrics that are important to consider when evaluating a spending policy over the long term (total long-term payout, real shortfall risk, and terminal asset value) and the short term (the risk of reducing real payout year over year).
They find:
- In the MA policy, lowering a target spending rate from 5% to 4% considerably lowers the risk of the endowment losing real value over the long term and the risk that the endowment’s real payout will be cut year over year, especially in an environment of sustained low returns.
- In comparing the MA policy with the SIT policy, the SIT approach may be a prudent choice for managing spending policy risk in the years ahead. In fact, they show that SIT provides reduced year-over-year volatility in spending (without a meaningful sacrifice of longer-term NAV).
- A 3%–7% SIT policy offers a simple and intuitive mechanism to effectively adjust an institution’s spending rate downward as conditions warrant.
Why does it matter?
Given the difficulties that many endowed institutions faced in 2008-2009, the authors think that now is a prudent time to evaluate whether spending policies should be changed in the best interests of the institution those policies support.
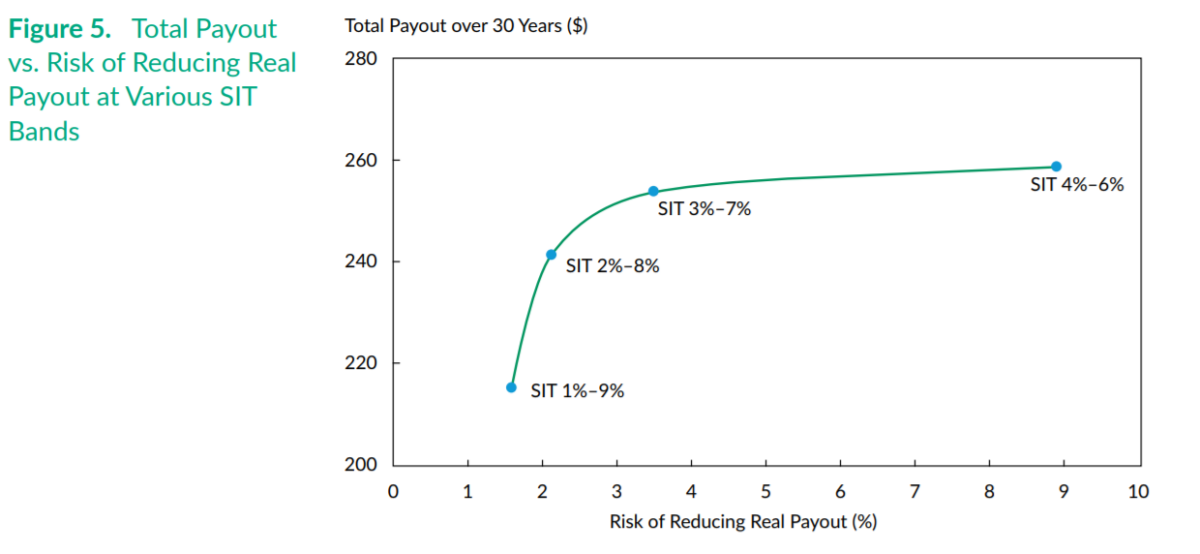
The Most Important Chart from the Paper
Figure 5 indicates that a 3%–7% band may be an effective choice because the risk curve flattens out meaningfully beyond the 3%–7% point. In this paradigm, the total payout over 30 years is approximately the same as that of the 4%–6% choice but with considerably less year-over-year downward risk in spending.
Abstract
For an endowment seeking to minimize payout variability while preserving the long-run health of the institution, appropriate spending policy is a crucial choice. We study two competing methods for setting spending policy—the “moving-average” method and the “snake-in-the-tunnel” (SIT) approach. We show that the SIT approach may significantly decrease the possibility of spending reductions in the short run. Additionally, the SIT approach with 3%–7% bands allows for a smooth evolution of payouts over time, which enhances spending predictability while preserving the endowment’s real (inflation-adjusted) long-run purchasing power.

About the Author: Wesley Gray, PhD
—
Important Disclosures
For informational and educational purposes only and should not be construed as specific investment, accounting, legal, or tax advice. Certain information is deemed to be reliable, but its accuracy and completeness cannot be guaranteed. Third party information may become outdated or otherwise superseded without notice. Neither the Securities and Exchange Commission (SEC) nor any other federal or state agency has approved, determined the accuracy, or confirmed the adequacy of this article.
The views and opinions expressed herein are those of the author and do not necessarily reflect the views of Alpha Architect, its affiliates or its employees. Our full disclosures are available here. Definitions of common statistics used in our analysis are available here (towards the bottom).
Join thousands of other readers and subscribe to our blog.