The Covariance Matrix of Real Assets
- Marielle De Jong
- The Journal of Portfolio Management, Fall 2018
- A version of this paper can be found here
- Want to read our summaries of academic finance papers? Check out our Academic Research Insight category
What are the Research Questions?
Variance and covariance are widely accepted risk measures for liquid assets that trade in public markets. Illiquid assets are not part of this framework because of their lack of regular price quotes and thus time variance. Due to the difficulty in using standard risk measures to assess non-traded assets, illiquid assets are often analyzed using different tools and analyzing the risk of these investments has been challenging. (see here for a discussion and here for a some cutting edge research on the topic).
The author investigates the following research question related to the challenge of understanding the portfolio risks of real assets:
- Is it possible to develop a framework for assessing the risk of real assets?
What are the Academic Insights?
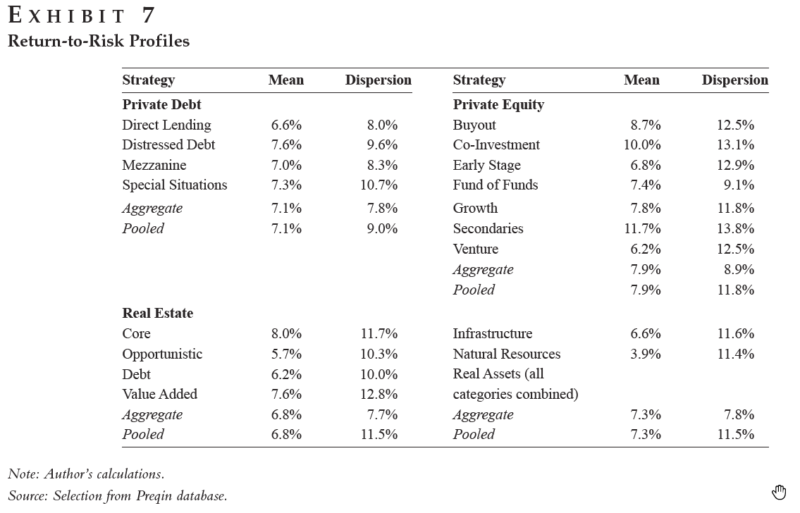
In her research, Marielle De Jong, Ph.D. measures the return variance and covariance as is usually done for liquid assets, except over the cross-section. The dispersion in return performance thus becomes the risk metric, not time variation.
By testing this framework over a large set of funds (4,939 funds with data from Prequin) that are invested in real assets (private equity, real estate, private debt, infrastructure, and natural resources), she finds the following:
- All correlations are positive with the average correlation equal to 0.5.
- The cross-correlation between funds invested in private equity and funds invested in private debt is 0.6, on average. Cross-correlation is as high as 0.9 between aggregate portfolios invested in private equity and in private debt.
- The risk-return profile of this group of funds is higher than that of equity and bonds (0.6 vs 0.3 Sharpe ratio). This gap is probably explained by the lack of liquidity of these investments but we should also keep in mind that data, in this case, is in large part unrealized expectations declared by the fund managers.
- The investment risk based on the author’s measurements lies somewhere between that of equities, which have a volatility between 15% and 20%, and bonds, which have a volatility between 5% and 10%.
Why does it matter?
The author proposes a new approach to assessing the investment risk of portfolios that contain real assets by estimating a price covariance matrix over the cross-section. This method is simple to apply and connects with the established methodology developed on liquid assets making risk easier to understand and allowing portfolio construction of illiquid assets to become more similar to traditional portfolio construction.
The Most Important Chart from the Paper:
The results are hypothetical results and are NOT an indicator of future results and do NOT represent returns that any investor actually attained. Indexes are unmanaged and do not reflect management or trading fees, and one cannot invest directly in an index.
Abstract
For real assets such as private equity, infrastructure, and real estate, computing the time-variance of trade prices is of limited interest because there is not much trading in these assets. The author argues that it is more meaningful to use variance measures over the cross section as indicators for investment risk. In a large database of funds invested in sparsely traded assets, the cross-sectional variance—or dispersion—of fund performances is measured within and between the asset classes in which they are invested. The covariance matrix that is estimated in this way has features similar to the matrix between regularly traded assets that is computed over time. The author argues that the matrix provides a practical framework for analyzing risk and constructing portfolios invested in real assets with the same methods that are habitually employed on liquid assets.

About the Author: Wesley Gray, PhD
—
Important Disclosures
For informational and educational purposes only and should not be construed as specific investment, accounting, legal, or tax advice. Certain information is deemed to be reliable, but its accuracy and completeness cannot be guaranteed. Third party information may become outdated or otherwise superseded without notice. Neither the Securities and Exchange Commission (SEC) nor any other federal or state agency has approved, determined the accuracy, or confirmed the adequacy of this article.
The views and opinions expressed herein are those of the author and do not necessarily reflect the views of Alpha Architect, its affiliates or its employees. Our full disclosures are available here. Definitions of common statistics used in our analysis are available here (towards the bottom).
Join thousands of other readers and subscribe to our blog.