If an investor would state today that in ten or twenty years most portfolios would include an allocation to cryptocurrencies, they would likely be laughed at. However, a similar response would have been encountered in the Internet Bubble and someone proposed to invest in low-risk stocks.
During that time, investors were ignoring boring companies like REITs or utilities and were plowing into exciting technology stocks, especially ones whose name included a “.com”.(1) Furthermore, the theory of low-risk stocks outperforming high-risk stocks, even if only on a risk-adjusted basis, seems to be in direct violation of capital market wisdom and theory, where a higher risk should earn a higher return, on average.
Fast forward to 2020 and Low Volatility has become a favorite factor in investment portfolios with broad support from academic research. Investing in low-risk stocks is still unexciting, given the nature of the businesses, but comes with the comforting hypothesis that one can potentially achieve equity-like returns at a lower risk.
Investors interested in spicing up such a portfolio can combine the Low Volatility with the Momentum factor, which then becomes betting on boring winners. We recently showed in a research note that this factor combination generated attractive excess returns across stock markets globally over the last 30 years. Some investors are suggesting that this combination is superior to an older favorite – betting on cheap winners.
In this short research note, we pit global Low Volatility-Momentum (LOVM) factor investing portfolios (a Lawrence Hamtil favorite) against global Value-Momentum (VMOM) factor investing portfolios (an Alpha Architect favorite!).
What’s the punchline?
Looking for absolute returns?
- Go with value and momentum.
Looking for risk-adjusted returns?
- Both approaches essentially up in the same place, with an arguable edge going to low-vol and momentum.
Best portfolio construction approach?
- The combination approach (e.g., identify the best value stocks, identify the best momentum stocks, and allocate to both portfolios) is the most attractive from a construction standpoint.
So pick the version that makes you comfortable, hunker down for the long-haul, and prepare for plenty of tracking error.
Multi-Factor Low-Vol, Value, and Momentum Combination Portfolios
We focus on all stocks in the US, European, and Japanese stock markets above a market capitalization of $1 billion. Combining factors into a multi-factor portfolio can be achieved by three methodologies, which are as follows:
- Intersectional Model: The universe of stocks is sorted simultaneously by both factors and the stocks in the intersection are chosen.
- Combination Model: The universe of stocks is sorted by factors separately and the two portfolios are then combined.
- Sequential Model: Stocks are first ranked by one factor and a second factor then sorts the resulting universe of stocks.
We create long-only Low Volatility-Momentum and Value-Momentum portfolios by utilizing the intersectional and combination methodologies. The sequential model produces results that are comparable to the intersectional model. The factor definitions are in line with academic and industry standards.
Stocks are weighted by market capitalization, rebalanced monthly, and we include 10 basis points of costs for each transaction. The portfolios are constructed to hold the same amount of stocks, which is 10% in the US and 20% in other markets.
Low-Vol and Momentum (LOVM) versus Value and Momentum (VMOM)
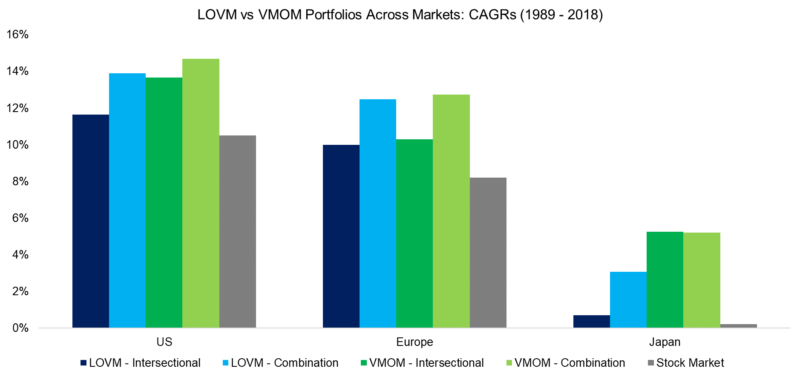
The LOVM and VMOM portfolios generated higher returns than the stock markets across regions in the period from 1989 to 2018, supporting the case for factor investing. We observe that VMOM outperformed LOVM portfolios in the US, Europe, and Japan. Furthermore, the combination model, which essentially represents a barbell strategy of combining extreme single-factor portfolios, was more attractive for creating multi-factor portfolios than the intersectional model.
It is worth noting that LOVM and VMOM portfolios generated most of the excess returns between 1989 and 2010, which includes the tech bubble implosion and great financial crisis. Since 2010, the excess returns have been only slightly positive in the US and Europe, but negative in Japan.
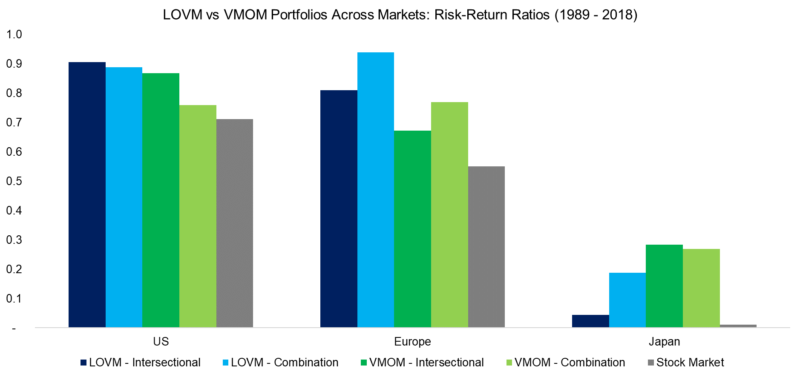
Next, we switch the perspective from returns to risk-adjusted returns, which highlights that boring winners generated better risk-return ratios than cheap winners in two out of three stock markets. The objective of Low Volatility investing is to produce better risk-adjusted returns, which was achieved even when combined with the Momentum factor.
Low-Vol, Value, and Momentum Factor Performance: Additional Tests
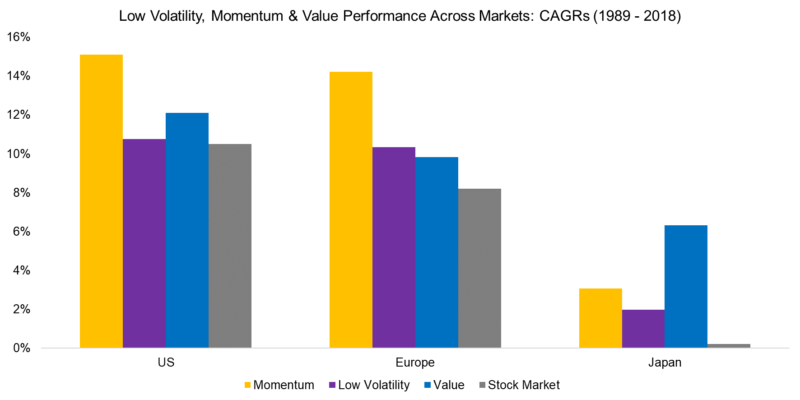
The positive excess returns of LOVM and VMOM portfolios can be attributed to the performance of the Momentum factor in the US and Europe, but to Value in Japan in the period from 1989 to 2018. Japanese investors are known for their preference for mean-reversion over trend following strategies, so this result is somewhat expected.
We need to again highlight that post the financial crisis in 2009, the factors generated significantly lower excess returns than in previous decades. The best performing factor in recent years was Low Volatility in Europe, which perhaps is explained by the low-risk stocks, which exhibit interest rate-sensitivity, benefitting from decreasing interest rates due to the ECB’s quantitative easing program.
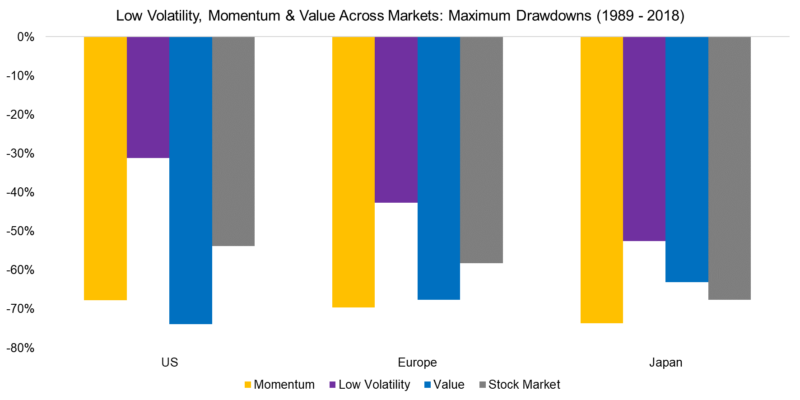
When we analyze the maximum drawdowns of the single factors over the last 30 years, the attractiveness of low-risk stocks becomes apparent given significantly lower drawdowns. In contrast, winners and cheap stocks fell more than the stock markets on average.
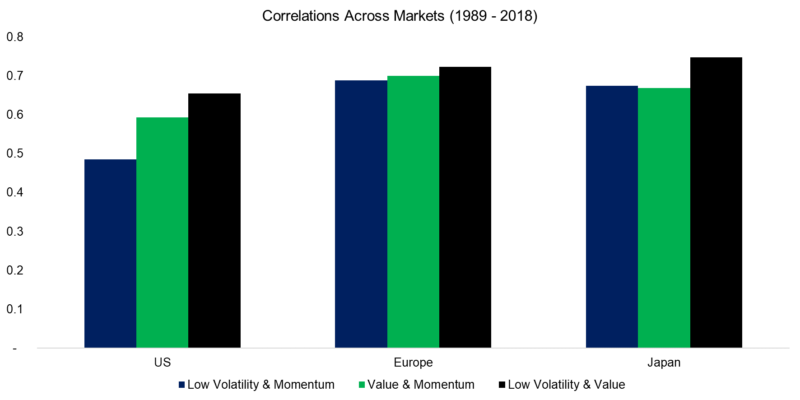
Critical for creating diversified multi-factor portfolios is how these relate to each other. The Low Volatility and Momentum factors are particularly attractive from this perspective as they are only moderately correlated, however, the same applies to Value and Momentum. It is interesting that low-risk and cheap stocks were relatively highly correlated, which would have made this a less attractive combination.
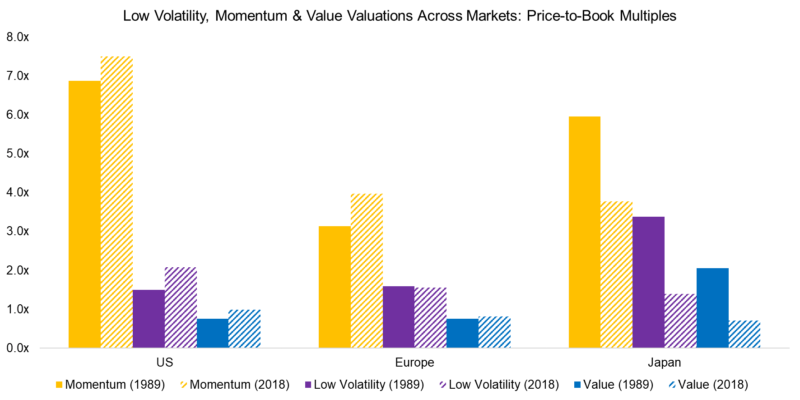
Next, we calculate the fundamental valuations of the three factors, which can also be used in evaluating the attractiveness of the LOVM and VMOM portfolios. Winning stocks were trading at far higher price-to-book multiples than low-risk and cheap stocks.
All factors in the US have become more expensive since 1989 while unchanged stocks in Europe. The Japanese stock market had its peak in 1989 and was trading at abnormally high valuations, which explains why all factors have become cheaper based on fundamental valuation metrics since then.
The Final Horserace: Global Low-Vol and Momentum Against Global Value and Momentum
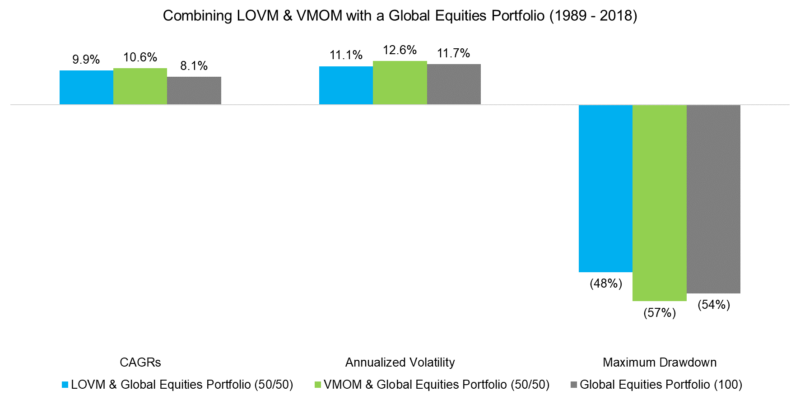
Finally, we simulate how accretive an allocation to LOVM or VMOM portfolios, created via the combination model, would have been in the context of a global equities portfolio, which all are comprised of 50% US, 25% European, and 25% Japanese stocks. We allocate 50% to either strategy, which shows higher returns from cheap winners, but lower volatility and a reduced maximum drawdown from boring winners, compared to the market itself.
Concluding Thoughts
Should investors prefer boring over cheap winners?
Based on this analysis, there is no clear answer. The Low Volatility factor had significantly lower drawdowns than Value, but both feature low correlations to Momentum, which creates attractive multi-factor portfolios. Cheap stocks have not performed well over the last decade, but are cheaper, per definition, and low-risk stocks exhibit interest rate-sensitivity.
Investors considering either combination should monitor the factor correlations. Boring is great, as long as it is not expensive.
About the Author: Nicolas Rabener
—
Important Disclosures
For informational and educational purposes only and should not be construed as specific investment, accounting, legal, or tax advice. Certain information is deemed to be reliable, but its accuracy and completeness cannot be guaranteed. Third party information may become outdated or otherwise superseded without notice. Neither the Securities and Exchange Commission (SEC) nor any other federal or state agency has approved, determined the accuracy, or confirmed the adequacy of this article.
The views and opinions expressed herein are those of the author and do not necessarily reflect the views of Alpha Architect, its affiliates or its employees. Our full disclosures are available here. Definitions of common statistics used in our analysis are available here (towards the bottom).
Join thousands of other readers and subscribe to our blog.

