Equity Styles and the Spanish Flu
- Guido Baltussen, Pim van Vliet
- A version of this paper can be found here
- Want to read our summaries of academic finance papers? Check out our Academic Research Insight category
What are the Research Questions
When I was in the Marines we were “voluntold” to read a lot on the history of warfare. This mandate came from General Mattis’ desire that we lean on the 5,000+ years of fighting experience amongst us illustrious humans. Of course, history never tells you exactly what will happen in the future, but the perspective of history can be useful for preparing ourselves for the future.
In a similar vein, our friends at Robeco have written a short piece on how factors performed during the Spanish Flu. (Here is another nice discussion of the topic from Jamie Catherwood and a free book on the subject.) The Spanish-Flu of 1918-1919 shares many things in common with the COVID-19 pandemic we’re all experiencing at the moment (unfortunately!). For most, looking at historical returns of equity markets during timeframes before CRSP(1) is a challenging endeavor. However, the authors of this paper tap into data they have hand-collected (excited to learn more), which affords them a unique look at the historical record from 1918-1919.(2) (3)
What are the Academic Insights?
First, the authors describe the general picture of how the Spanish Flu came in three waves. The first began in March of 1918 and lasted up until the summer, the second — and the deadliest wave — came in the fall of 1918 between October and December, and the final wave came in the spring of 1919, after which the virus disappeared.
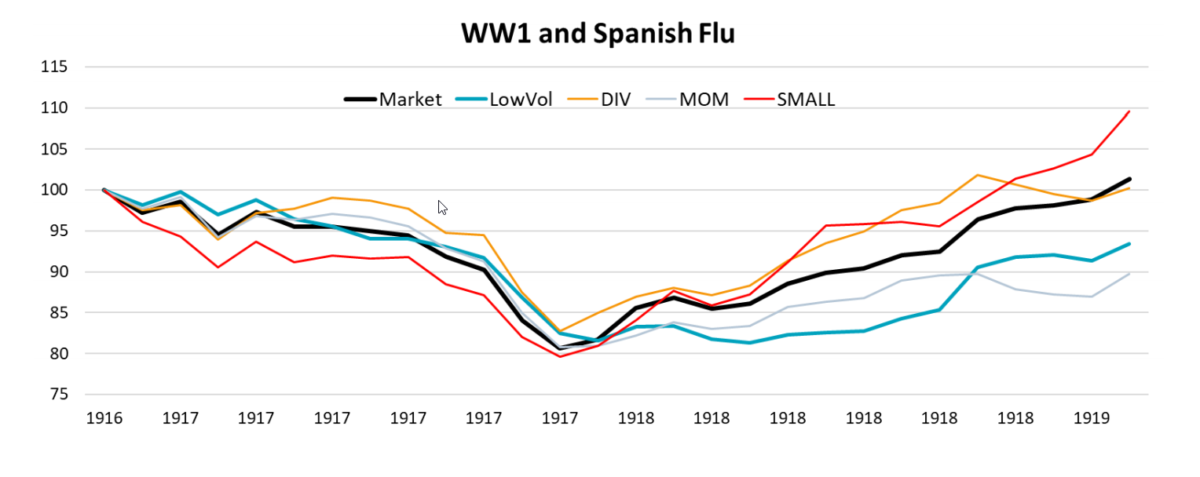
So how did equity markets perform during this time? The authors adjusted their data for any size effects since the market in the early 1900s was characterized by many listings of small thinly traded equities. During the initial drawdown of the market, the authors found that, like the COVID-19 Flu drawdown, there really was nowhere to hide.(4) It wasn’t until that second wave of the pandemic that markets truly bottomed, after which small stocks and high dividend stocks to a lesser extent outperformed.

The sample of equity market returns during pandemics is limited, so the authors look at the performance of factors through seven corrections and seven subsequent recoveries that occurred between 1876 and 1919. In those periods a pattern emerged that showed low-volatility and momentum offered some protection. The authors also presented their own special conservative strategy, which combines volatility, momentum, and yield into one strategy (LowVol+).

Why does it matter?
Speculation is rampant at the moment regarding the implications of how the current pandemic could affect the stock market. Clearly, looking at the past can only give us a hint at how the our current pandemic will unwind and what factors will outperform, but the good news is that observing the pandemics of the past, one thing is certain, they all have a track record of ending. The research the authors have done may give us a picture of how to position ourselves going forward, to be aware of the potential of multiple pandemic waves, and some ideas on where we can start bargain hunting (e.g., small value).
Abstract
We study the performance of equity styles during the period around the Spanish Flu pandemic of 1918-1919 and other deep historical market corrections to gain a deeper understanding on the performance of different groups of stocks during crises. We extend the widely used CRSP database with hand-collected data on U.S stocks and examine the major pre-1926 market corrections, such as the bankers panic of 1907. We find that low-volatility and momentum tend to reduce losses during sharp market selloffs. By contrast, smaller stocks with high yields (value) tend to not offer protection during these sharp market corrections but perform well during the recovery phase.
References[+]
| ↑1 | the most common database quants choose to data-mine :-) |
|---|---|
| ↑2 | Baltussen, Van Vliet, and Van Vliet (2020) supplement the CRSP stock database with hand-collected data back until 1866. This study will be available later this year including all details on the investment universe and database construction. For the 1918-1919 case study, the authors cover 523 US stocks for which they have market capitalization data and at least 1 year of returns |
| ↑3 | Here is the recent performance.
For reference the authors compiled the recent performance of how major factors have performed each month this calendar year using MSCI global indices in EUR (as of 3/27/20):  Here is the version from their more updated paper, which uses data through 3/31/2020.  |
| ↑4 | hint: the real drawdowns occurred post-Spanish Flu and post-WW1, where your only protection was to be a trend follower! |
About the Author: Wesley Gray, PhD
—
Important Disclosures
For informational and educational purposes only and should not be construed as specific investment, accounting, legal, or tax advice. Certain information is deemed to be reliable, but its accuracy and completeness cannot be guaranteed. Third party information may become outdated or otherwise superseded without notice. Neither the Securities and Exchange Commission (SEC) nor any other federal or state agency has approved, determined the accuracy, or confirmed the adequacy of this article.
The views and opinions expressed herein are those of the author and do not necessarily reflect the views of Alpha Architect, its affiliates or its employees. Our full disclosures are available here. Definitions of common statistics used in our analysis are available here (towards the bottom).
Join thousands of other readers and subscribe to our blog.

