Investing is never easy, but some times are easier than others. Buying US government bonds at 10%+ yields when inflation was steadily decreasing in the 1980s was probably less worrying than buying them today at negative real yields. In today’s world, bonds may have largely lost their income-generating purpsose, although they still constitute a large proportion of investors’ portfolios.
What is a yield-hungry investor supposed to do in this environment? Increasing the allocation to equities seems like the only choice for most investors, leaving alternatives like private equity aside. However, the outlook for equities is also not rosy given high valuations in the US and poor demographics in most developed and many emerging markets. Economic growth depends on healthy demographics. And there is also the rising amount of debt in society, which is bound to have negative consequences on growth at some point.
The most frequent argument to escape this dire outlook is to focus on high-quality companies with sustainable growth, defensible business models, high profitability, and low leverage. Intuitively, using our quick-reaction, i.e., “system one,” thinking style, this advice sounds rational. It isn’t until we kick in our rational brain, i.e., “system two,” where we can question seemingly simple and clear advice. Such great stocks are likely to be expensive as they are highly appealing to most investors, and high-profit margins tend to be disrupted by new market entrants.
Although we can not forecast how high-quality stocks will perform in the future, we can certainly evaluate their historical performance. In this short research note, we will evaluate high-quality companies through the lens of quality-themed ETFs in the US.
THE GROWTH IN ASSETS OF SMART BETA QUALITY ETFS
We focus on all quality ETFs in the US, which broadly come in two flavors: pure quality and quality income. The stock selection process varies significantly across ETF issuers as there is no standard definition for quality. However, it tends to be multi-metric approaches that include ratios like earnings stability, leverage, and profitability.
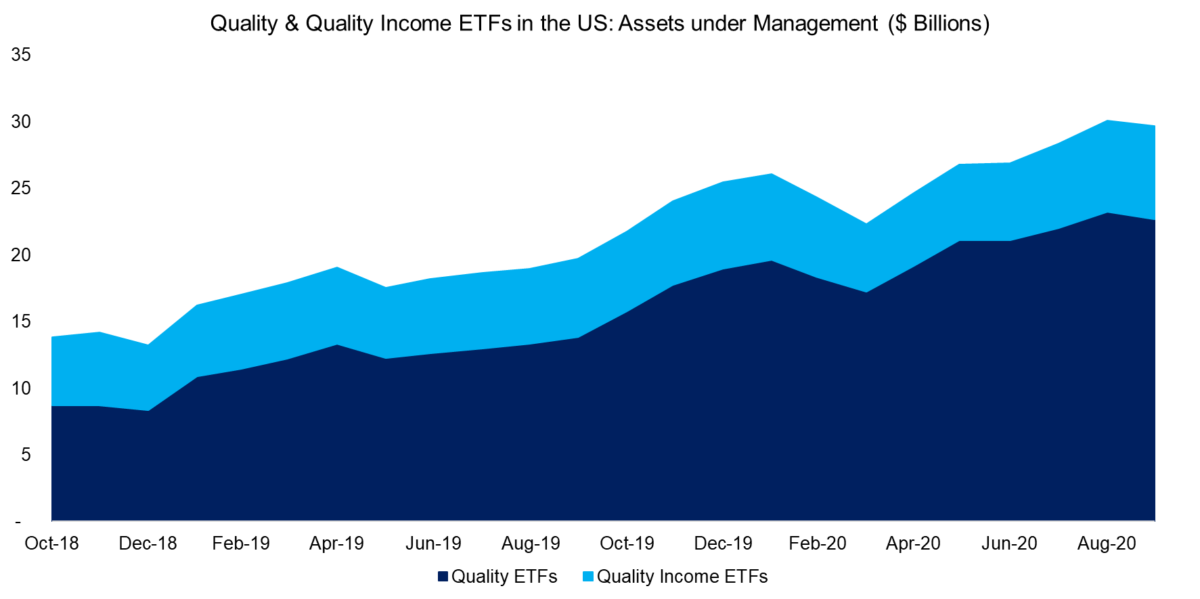
We observe that the assets under management in quality and quality income ETFs have almost doubled between 2018 and 2020. However, it is worth highlighting that the aggregate amount of assets of slightly under $30 billion represents a fraction of the capital allocated to other smart beta categories. For example, investors have allocated approximately $70 billion to low volatility ETFs, which is surprising given that this factor only became popular post the global financial crisis in 2009. Even more surprising is that more than $200 billion are invested in growth ETFs, despite there being almost zero academic support on this investment style having any useful characteristics like generating outperformance or reducing risk.
SELECTING QUALITY ETFS
Investors can select ETFs qualitatively, quantitatively, or apply a combination of both approaches. A qualitative approach is to simply search for ETFs that contain terms like “Quality” or “Defensive” in their name, which results in less than 15 ETFs in the US that charge an average of 16 basis points (bps) per annum. It is worth noting that one product from iShares dominates this list with an 85% share of the assets under management.
Similarly, there are less than 10 quality income ETFs and two of these have an 82% market share. The average management fee is 32 bps, i.e. double the fee of quality-only products. The high fees are explained by quality income ETFs being primarily bought by income-loving retail investors, who are not particularly price-sensitive.
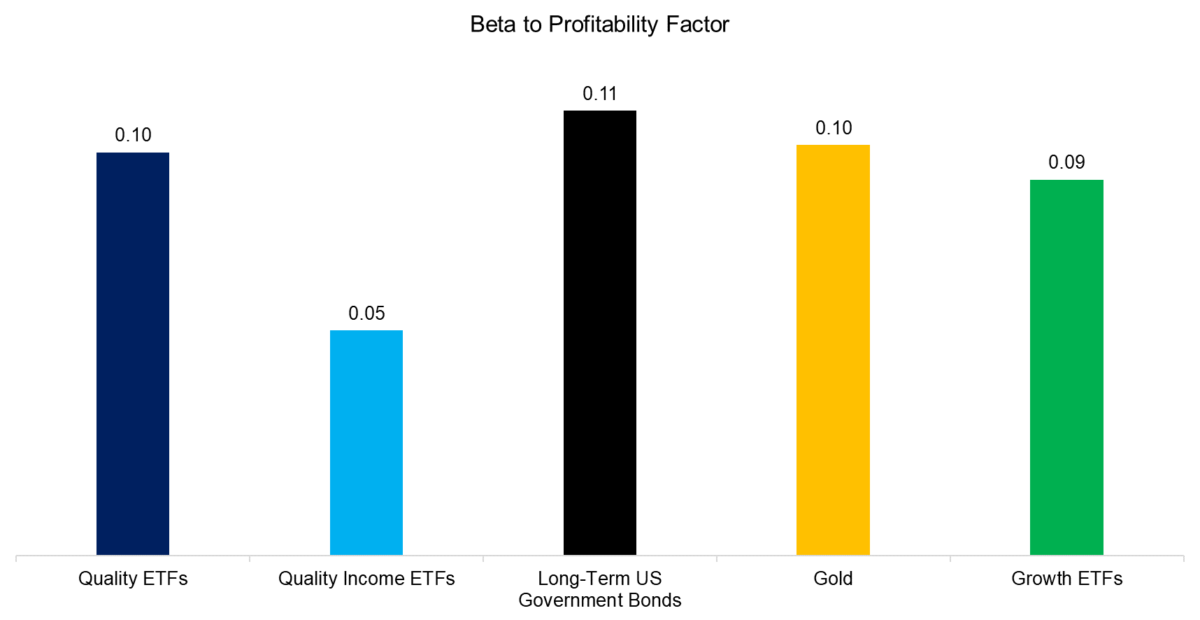
A quantitative approach to selecting quality ETFs would be to take a quality factor and regress the universe of all ETFs against that. Naturally, this requires defining the quality factor in the first place. In this analysis, we will use the profitability factor from the Fama-French five-factor model, i.e. also called robust minus weak (RMW), which measures the operating profitability of companies.
Somewhat surprisingly, quality and quality income ETFs do not feature particularly high factor betas to the profitability factor. In fact, the betas of long-term US government bonds, gold, and growth ETFs are approximately the same. The low betas of quality and quality income products can be attributed to ETF issuers using several metrics in the stock selection process versus solely focusing on profitability.
PERFORMANCE OF QUALITY ETFS
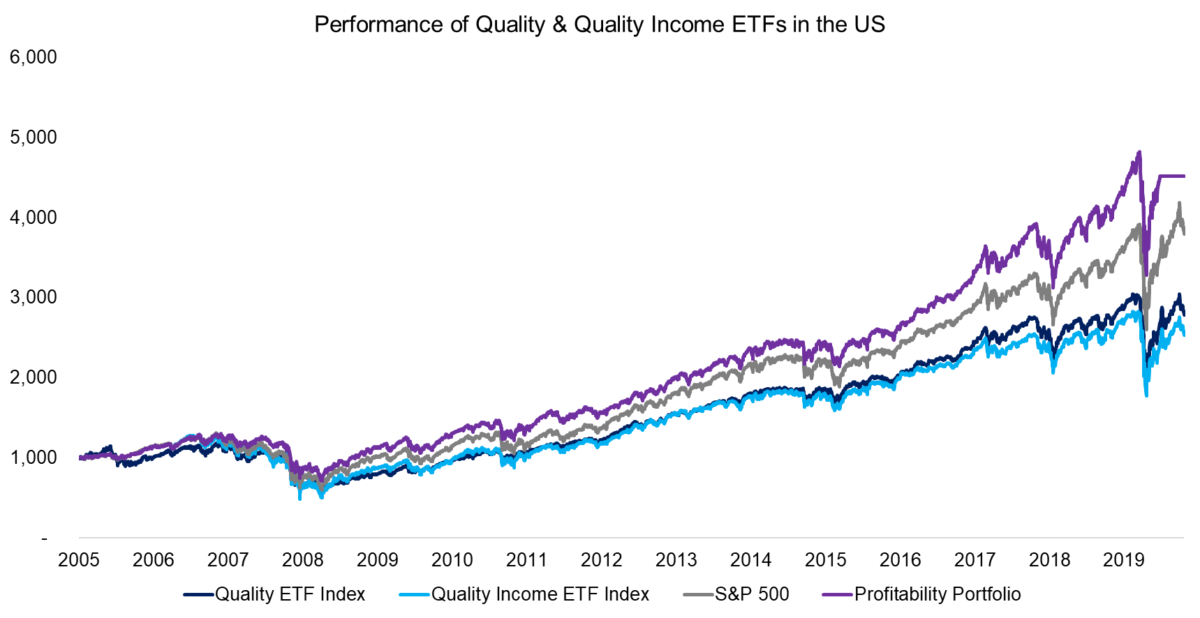
Next, we construct equal-weighted indices for quality and quality income ETFs, which highlight that both significantly underperformed the S&P 500 in the period from 2005 to 2020. Investors might question if management fees explain the underperformance. However, the management fees have become almost marginal in recent years and the underperformance has steadily been expanding, which implies different forces at work.
It is interesting to note that there was very little differentiation between quality and quality income, despite substantially different stock selection processes. Furthermore, a portfolio comprised of the 30% of stocks featuring the highest profitability would have outperformed all three indices, albeit before transaction costs.
REDUCING RISK WITH QUALITY ETFS
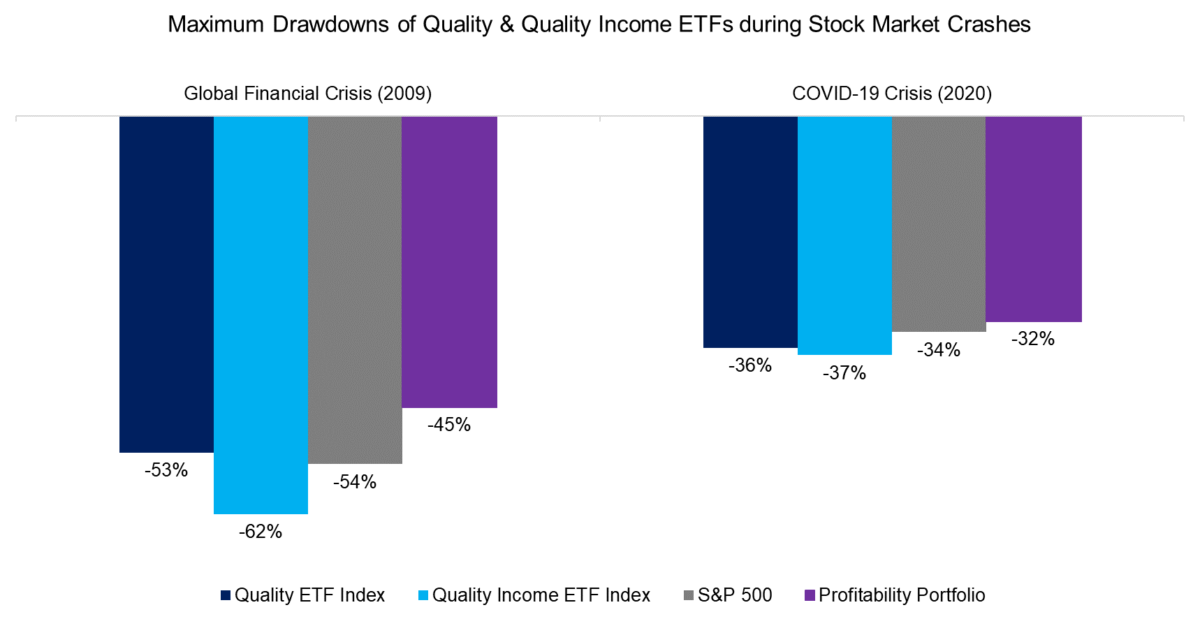
However, quality-themed products are not bought for outperformance, but for risk reduction. If quality ETFs reduced maximum drawdowns during stock market crashes, then they fulfilled their primary purpose and can be considered accretive for investors’ portfolios.
Unfortunately, neither quality nor quality income ETFs had significantly lower maximum drawdowns during the global financial crisis of 2009 or the more recent COVID-19 crisis of 2020, which resulted in lower risk-adjusted returns compared to the S&P 500. In contrast, the portfolio comprised of highly profitable stocks achieved meaningful reductions in drawdowns in both crisis periods.
SECTORAL BIASES OF QUALITY ETFS
In order to further evaluate the underperformance of the quality-themed ETFs, we investigate if there are sectoral biases compared to the S&P 500. We observe that quality ETFs had minor overweights to healthcare and consumer staples stocks and underweights to consumer discretionary and financials.
In contrast, the sectoral biases of quality income ETFs were significantly different, which is explained by the focus on high dividend-yielding stocks with quality characteristics. Specifically, there is a large overweight to industrials and basic materials and underweight to technology stocks. The latter is intuitive as many technology companies do not pay dividends, which makes them rank low when measured by their dividend yield.
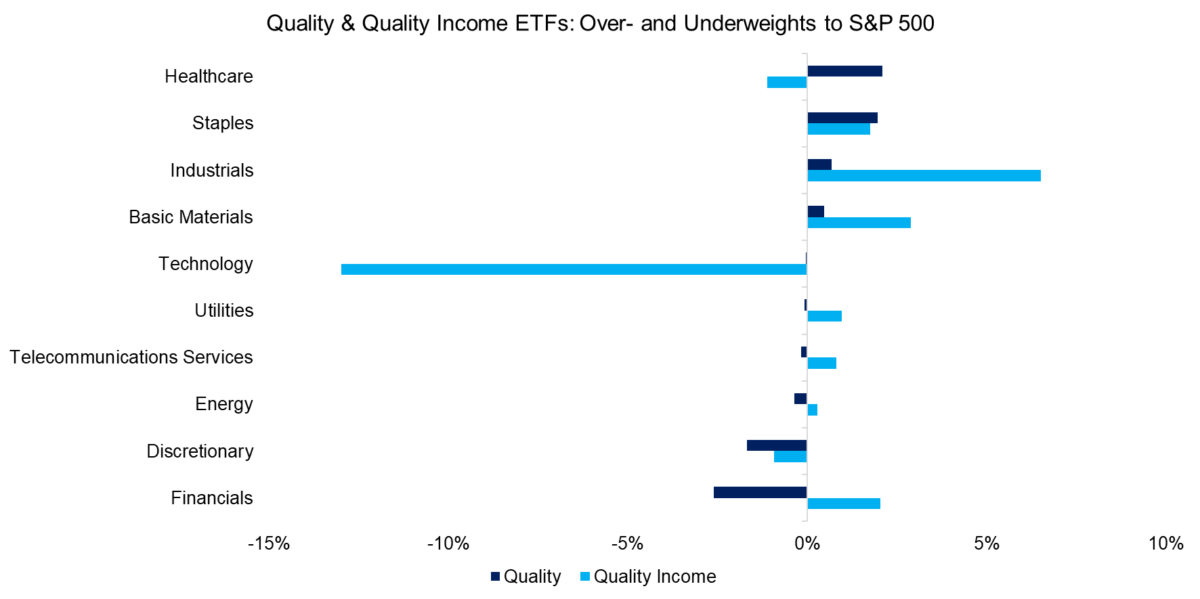
Given the different sectoral biases of quality and quality income ETFs, it is surprising that they performed so similarly. The underperformance of quality income ETFs to the S&P 500 is simply explained by the underweight in the technology sector as this was one of the best-performing sectors in the period from 2000 to 2010.
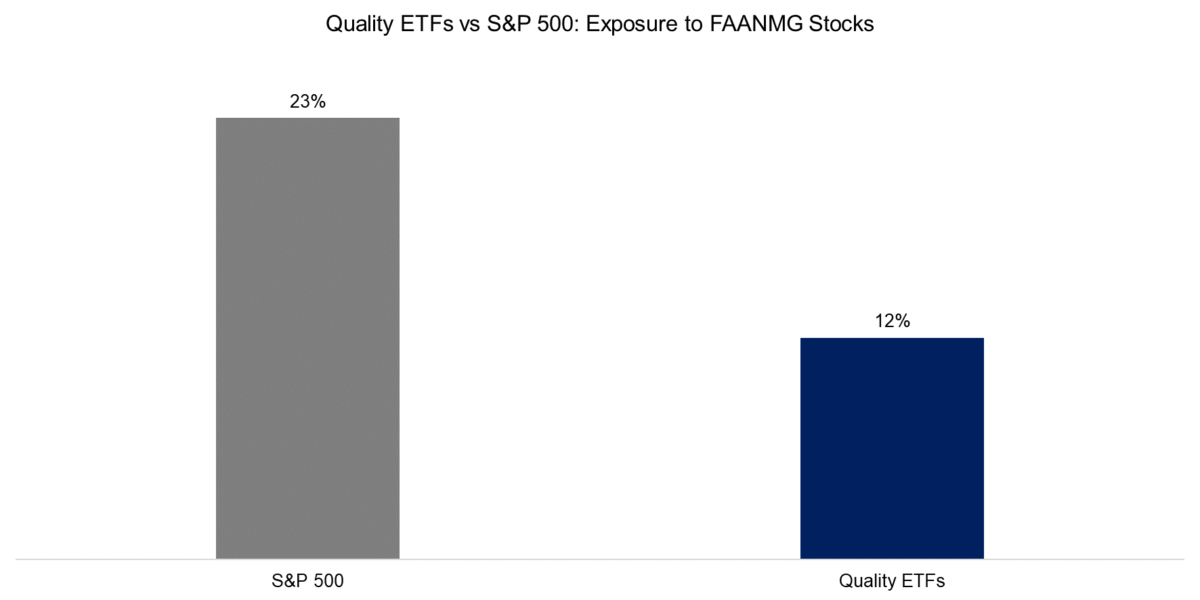
The underperformance of quality ETFs is more difficult to explain as there is no underweight to technology stocks. However, a closer inspection shows that there is a much lower weight to the best-performing stocks, i.e. Facebook, Apple, Amazon, Netflix, Microsoft, and Google (FAANMG). A significant portion of the returns of the S&P 500 over the last decade can be attributed to these few stocks and having less exposure to these generated a large tracking error.
FURTHER THOUGHTS
Although the exposure to the FAANMG stocks was low in quality ETFs, some of these like Microsoft or Google can be considered high-quality stocks due to attractive operating margins and low leverage. However, what makes these companies unique is that they have become quasi-monopolies that face little disruption from new entrants. Although not impossible, it is currently difficult to imagine a firm that takes down Amazon given its massive scale.
It is interesting to contemplate building a portfolio of new monopoly companies (the ticker NeMo still seems available) with quality characteristics. However, these wonderful companies do come at high valuations and the risk of government interventions, which is becoming a larger risk as these companies are becoming more and more powerful.
RELATED RESEARCH
About the Author: Nicolas Rabener
—
Important Disclosures
For informational and educational purposes only and should not be construed as specific investment, accounting, legal, or tax advice. Certain information is deemed to be reliable, but its accuracy and completeness cannot be guaranteed. Third party information may become outdated or otherwise superseded without notice. Neither the Securities and Exchange Commission (SEC) nor any other federal or state agency has approved, determined the accuracy, or confirmed the adequacy of this article.
The views and opinions expressed herein are those of the author and do not necessarily reflect the views of Alpha Architect, its affiliates or its employees. Our full disclosures are available here. Definitions of common statistics used in our analysis are available here (towards the bottom).
Join thousands of other readers and subscribe to our blog.
