Asset pricing models are important because they help us understand which factors explain the variation of returns across diversified portfolios. However, models are not like cameras that provide a perfect picture of the world. If models were perfectly correct, they would be laws, like we have in physics. Instead, models are engines that advance our understanding of how markets work, and prices are set. The first formal model was the CAPM (capital asset pricing model), a single factor (market beta) model that was able to explain about two-thirds of the variation of returns among portfolios.
Since the development of the CAPM, academic research has attempted to find models that increase the explanatory power of the cross-section of stock returns. We moved from the single-factor CAPM (market beta), to the three-factor Fama-French model (adding size and value), to the Carhart four-factor model (adding momentum), to Lu Zhang’s q-factor model (beta, size, investment, profitability), to the Fama-French five-factor (adding value to the q-factor model) and six-factor models (adding back value and momentum to the q-factor model). There have also been versions that use different metrics for profitability and value, and Stambaugh and Yuan’s mispricing (anomaly)-based model. Regardless of the model used, stocks with high research and development (R&D) expenses have delivered a premium. Thus, the R&D premium remains an anomaly to all models. Despite a large literature confirming the anomaly, there is far less consensus on why it exists. Some studies attribute the R&D anomaly to investor mispricing. Others argue that it reflects a premium that compensates risk.
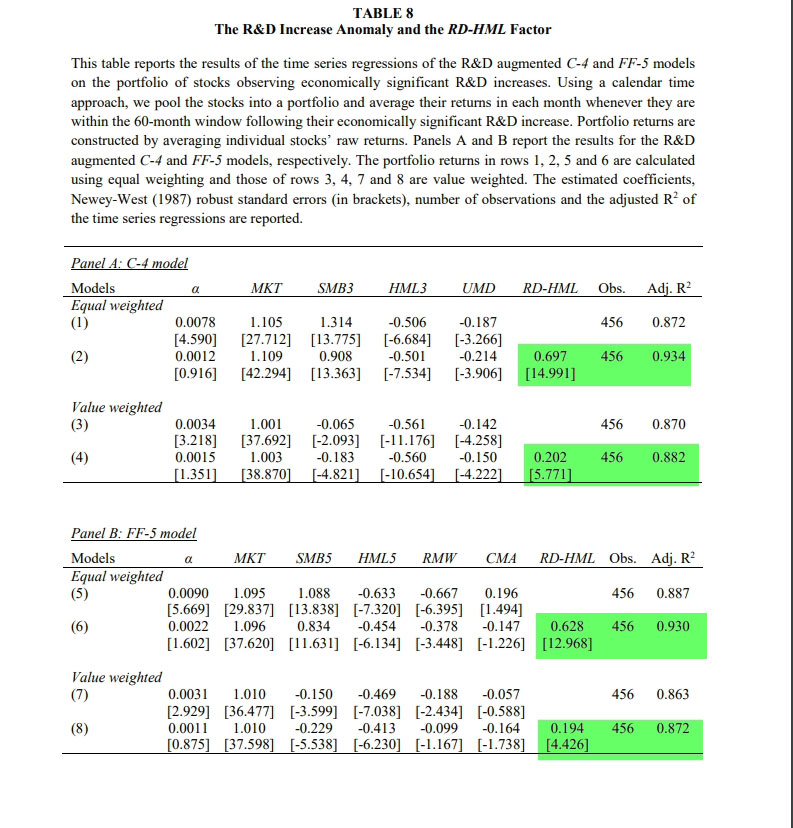
Woon Sau Leung, Khelifa Mazouz, and Kevin Evans contribute to the literature with their study “The R&D Anomaly: Risk or Mispricing?” published in the June 2020 issue of the Journal of Banking & Finance. Their data sample contained all NYSE, AMEX, and Nasdaq stocks and covered the period July 1975 to June 2013. They measured R&D intensity as the ratio of R&D expenditure to market value(MV), total assets(A), or sales(S), denoted as RD-MV, RD-A, and RD-S, respectively. For various reasons they only reported the results for RD-MV—RD-MV is associated with greater anomalous returns than RD-A and RD-S. RD-MV is analogous to price multiples and can therefore be readily applied to practical investment analysis, and it is less likely to be influenced by creative accounting. They found “a monotonic increase in average returns with RD-MV. The increase in return from 0.67 percent for Portfolio 1 to 2.23 percent for Portfolio 10 represents a statistically and economically significant return to the zero-cost spread portfolio (10-1). The R&D anomaly persists after we adjust for size, value, and momentum effects.” In addition, the zero-cost spread portfolio (Portfolio 10-1) yielded a Carhart four-factor alpha of 1.35 percent and a Fama French five-factor alpha of 1.52 percent per month, both significant at the 1 percent level—the R&D anomaly cannot be explained by existing pricing factors, including the relatively recent investment and profitability factors.
They also found that R&D-intensive companies generally are “smaller, have higher book-to-market equity ratio, better past stock performance, smaller asset growth, lower operating profitability, higher idiosyncratic volatility, lower stock liquidity, more extreme positive daily returns, greater information asymmetry, tighter capital constraints, less tangible assets, and greater firm-specific human capital.” These findings are generally consistent with a risk-based explanation.
Is it Risk?
To address this question, Leung, Mazouz and Evans began by providing a logical risk-based explanation for the R&D premium:
“There are four risks to R&D. Technical risk is the uncertainty of the success or failure of each stage of development, which is idiosyncratic. The risk of obsolescence is that competitive firms develop faster driving future cash flows to zero, which is idiosyncratic. The third risk is uncertainty about the expected cost of completion of the project. This is also idiosyncratic but evolves endogenously as managers learn about the probability of success as stages are completed. The final risk is the uncertainty surrounding the potential cash flows from the project. Cash flows upon completion are a stochastic process and include both idiosyncratic and systematic components.”
Leung, Mazouz and Evans then sought to identify the economic sources of R&D risk.
“If R&D projects convey a larger systematic risk premium that relates to future stochastic cash flows, we examine whether the R&D factor captures investors’ intertemporal hedging concerns and proxies for state variables that predict the future market and economic conditions.” They found that “the R&D premium correlates positively with innovations to the aggregate dividend yield, and negatively with shocks to the default spread and risk-free rate, demonstrating the sensitivity of R&D stocks to variables that predict future business conditions. Moreover, the loadings on these three state variable innovations are significantly priced in the cross-section of R&D stock returns and even drive outsize and book-to-market equity factors. These results demonstrate that the R&D premium represents a significant and incremental reward for bearing intertemporal risk.”
Is it Mispricing?
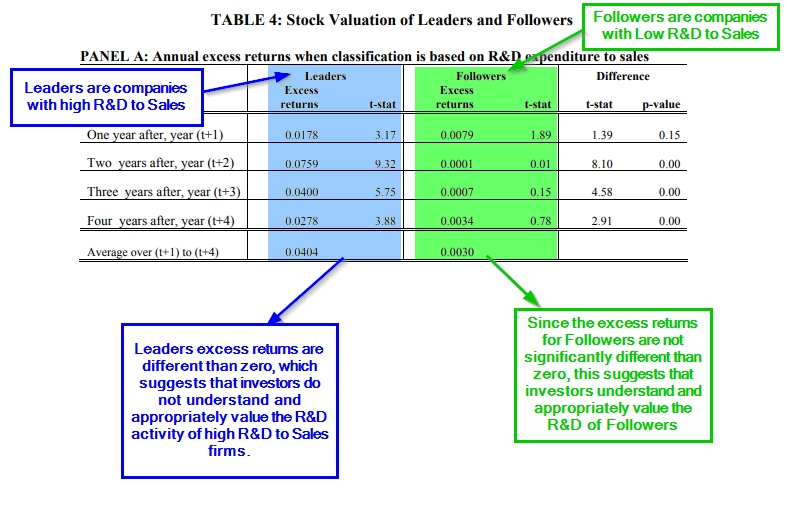
The finding of a risk-based explanation by Leung, Mazouz and Evans contrasts with the findings of Baruch Lev, Suresh Radhakrishnan and Mustafa Ciftci in their 2008 study “The Stock Market Valuation of R&D Leaders.” They found that “only a small part of the returns can be attributed to risk compensation.” They also found that “R&D is less reliable (verifiable) an asset than physical capital” and that “the association between R&D intensity and future earnings volatility of leaders is lower than that of followers. Collectively, the findings suggest that R&D leaders are mispriced by investors due to lack of information.” Note that it is possible that the publication of such research could lead to the elimination of any mispricing.
As noted above, one mispricing explanation is based on limited investor attention to R&D that is attributed to accounting conservatism: R&D costs are expensed, as financial statements do not report internally generated intangible assets under generally accepted accounting principles. Such conservative accounting treatments complicate investors’ valuation of an R&D-intensive firm, which often results in mispricing of its equity.
Leung, Mazouz, and Evans also examined other mispricing explanations, beginning with investor sentiment—the propensity of individuals to trade on noise and emotions rather than facts. It represents investors’ beliefs about future cash flows that the prevailing fundamentals cannot explain. Such activity can lead to mispricing. Examples of times when investor sentiment ran high are the 1968-69 electronics bubble, the biotech bubble of the early 1980s, and the dot.com bubble of the late 1990s. Sentiment fell sharply, however, after the 1961 crash of growth stocks, in the mid-1970s with the oil embargo, and in the crash of 2008.
Since 2006 researchers have explored investor sentiment’s impact on markets. Malcolm Baker and Jeffrey Wurgler have even constructed an investor sentiment index based on six metrics: trading volume as measured by NYSE turnover, the dividend premium (the difference between the average market-to-book ratio of dividend payers and non-payers), the closed-end fund discount, number of IPOs, first-day returns on IPOs, and the equity share in new issues. (Data is available at Wurgler’s New York University webpage.) Studies such as “The Short of It: Investor Sentiment and Anomalies” (2012), “Investor Sentiment and the Cross-Section of Stock Returns” (2006), “Investor Sentiment and the Mean-Variance Relation” (2011), and “Investor Sentiment: Predicting the Overvalued Stock Market ” (2018) have demonstrated that investor sentiment is a statistically and economically significant contrarian predictor of market returns.
The mispricing arguments related to R&D are that stocks with high levels of R&D are hard to value and more costly to arbitrage. Therefore, they are subject to larger mispricing and thus display corrections following shifts in sentiment. Contrary to this prediction, Leung, Mazouz and Evans found that sentiment has no effect on R&D portfolios—there was a monotonic increase in returns across R&D deciles following both sentiment states. They added that:
“any mispricing detected in R&D stocks is likely driven by the size effect rather than R&D intensity.”
The authors next examined whether limits to arbitrage have any effects on the R&D anomaly, and they failed to find evidence of mispricing in R&D stocks.
Their findings are consistent with those of Jangwook Lee and Jiyoon Lee, authors of the March 2020 study “Mispricing or Risk Premium? An Explanation of the R&D-to-Market Anomaly.” They examined the evidence on the R&D anomaly in Korea. Korea provides a unique opportunity because R&D expenditures are capitalized under certain (more conservative) conditions.
Lee and Lee noted:
“If the positive relationship between R&D and stock returns is attributable to limited investor attention that arises mainly from conservative accounting treatment of R&D there should not exist a positive association between the capitalized components of R&D and stock returns. The risk-based explanation, on the other hand, predicts a positive relationship between capitalized components of R&D and stock returns to the extent that the capitalized portion of R&D is risky.”
They demonstrated that both the expensed and capitalized portions of R&D are positively associated with returns. For example, they found that:
“a one-standard-deviation increase in CAP (EXP), which is defined as capitalized (expensed) components of R&D over the market value of equity, is associated with an increase in monthly stock returns of 17.9 (23.7) basis points after controlling for characteristics that are known to be associated with risks such as size, the book-to-market ratio, and momentum.”
And the returns increased monotonically with R&D intensity. They also showed that the positive R&D return relationship weakens with the extent of progress toward completion of R&D projects.
Their findings are consistent with the risk-based theoretical prediction of Jonathan Berk, Richard Green and Vasant Naik, authors of the 2004 study “Valuation and Return Dynamics of New Ventures.” They explained:
“Firms learn about the potential profitability of the project throughout its life, but that technical uncertainty about the R&D effort is only resolved through additional investment. Consequently, the risks associated with the ultimate cash flows have a systematic component even while the purely technical risks are idiosyncratic.”
Lee and Lee also found that firms whose R&D expenditures consisted only of capitalized components of R&D earned 24.9 basis points less per month than firms whose R&D expenditures consisted only of expensed components. This is exactly what we should expect if R&D is related to risk because capitalized R&D should be less risky in order to meet the six criteria established by the Korean accounting practices. They also found that the decrease in returns following progress toward R&D completion is fully explained by conventional risk factors. Their findings led them to conclude:
“The results suggest overall that the positive R&D-return relationship is attributable to compensation for bearing risk.”
Lee and Lee did offer this important observation:
“This paper also adds to the literature on the information benefits of R&D capitalization by providing evidence that R&D capitalization provides useful information regarding risk to investors, and we thereby contribute to the debate among academics and practitioners overcapitalization versus expensing of R&D expenditures.”
Summary
There is considerable evidence of a significant positive relationship between R&D and future stock returns that is not explained by existing asset pricing models. Their findings led Leung, Mazouz, and Evans to conclude that:
“The R&D anomaly is a reward for the systematic risk embedded in the real option features of R&D project—anomalous returns to high R&D stocks represent compensation for heightened systematic risk not captured in standard asset pricing models.”
Lee and Lee came to the same conclusion.
Because of the differences in accounting treatments for intangible versus tangible assets (expensing or capitalizing), and the findings of an R&D premium, this topic has received much attention from academics and practitioners alike. Some have tried to address the problem by adding back expensed R&D to the balance sheet, and others by including R&D as a priced factor.

About the Author: Larry Swedroe
—
Important Disclosures
For informational and educational purposes only and should not be construed as specific investment, accounting, legal, or tax advice. Certain information is deemed to be reliable, but its accuracy and completeness cannot be guaranteed. Third party information may become outdated or otherwise superseded without notice. Neither the Securities and Exchange Commission (SEC) nor any other federal or state agency has approved, determined the accuracy, or confirmed the adequacy of this article.
The views and opinions expressed herein are those of the author and do not necessarily reflect the views of Alpha Architect, its affiliates or its employees. Our full disclosures are available here. Definitions of common statistics used in our analysis are available here (towards the bottom).
Join thousands of other readers and subscribe to our blog.