Two of the more interesting puzzles in finance are the high beta anomaly (high beta stocks have lower returns) and the IVOL anomaly (stocks with greater idiosyncratic volatility have produced lower returns). These are anomalies because both beta and IVOL are viewed as risk factors and should be rewarded with higher, not lower, returns. While both anomalies have attracted much attention from researchers, only the beta anomaly (with about 60 exchange-traded funds and more than $100 billion in assets under management dedicated to exploiting it), has attracted much investor attention.(1)
Studies such as “Arbitrage Asymmetry and the Idiosyncratic Volatility Puzzle” (summary/background here) by Robert Stambaugh, Jianfeng Yu, and Yu Yuan, which appeared in the October 2015 issue of The Journal of Finance, have provided explanations for the anomalies. The explanation for why they persist is that there is “arbitrage asymmetry”—the greater ability and/or willingness of investors to take a long position as opposed to a short position when they perceive mispricing in a security. Asymmetry occurs because there are greater risks and costs involved in shorting, including the potential for unlimited losses.
In addition to the greater risks and costs of shorting, for stocks with a low level of institutional ownership, there may not be sufficient shares available to borrow to facilitate selling short. Which increases the cost of shorting even more. Furthermore, the charters of many institutions prevent, or severely limit, shorting. And finally, there is the risk that adverse moves can force capital-constrained investors to reduce their short positions before realizing profits that would ultimately result from corrections of mispricing. Importantly, when IVOL is higher, substantial adverse price moves are more likely.
Stambaugh, Yu and Yuan demonstrated that the IVOL effect is significantly negative (positive) among the most overpriced (underpriced) stocks, and the negative effect among the overpriced stocks is significantly stronger—the negative highest-versus-lowest difference among the most overpriced stocks was 3.7 times the magnitude of the corresponding positive difference among the most underpriced stocks. They also found that the vast majority of the differences in returns were explained by the short side (the most overpriced stocks). In addition, IVOL increased monotonically, moving across deciles from the most underpriced to the most overpriced.
Moreover, consistent with their model, they found that the negative IVOL effect among overpriced stocks is stronger for stocks that are less easily shorted (as proxied by stocks with low institutional ownership). The authors also found that while the IVOL effect was strongest among overpriced small stocks—consistent with small stocks being more difficult/expensive to short than large stocks—the effect holds for large stocks as well, though it’s no longer statistically significant at conventional levels.
Also of interest, they found that the average negative relation between IVOL and expected return is stronger in periods when there is a market-wide tendency for overpricing (when investor sentiment is high). Their findings are consistent with those of Andrew Detzel, Jefferson Duarte, Avraham Kamara, Stephan Siegel, and Celine Sun, authors of the 2019 study “The Cross-Section of Volatility and Expected Returns: Then and Now.” Their study updated prior research by extending the data sample, from July 1926 to 2016. In addition, they benchmarked returns against newer asset pricing models: the Fama-French five-factor (market beta, value, size, profitability, and investment) model; a Fama-French six-factor model, which adds momentum; the four-factor q-model of Kewei Hou, Chen Xue, and Lu Zhang (market beta, size, profitability, and investment); the four-factor mispricing model of Stambaugh and Yuan; and the Bayesian six-factor model of Francisco Barillas and Jay Shanken, which is updated monthly.
Following is a summary of their findings:
- The difference in abnormal returns between stocks with high and low IVOL decreases but remains significant out of sample.
- The newer Fama-French five- and six-factor and q-factor models do not resolve the IVOL anomaly found in prior research. However, the four-factor model of Stambaugh and Yuan and the six-factor model of Barillas and Shanken resolve the anomaly out of sample and over the extended period of 1967 to 2016. They also eliminate the arbitrage asymmetry that Stambaugh, Yu, and Yuan proposed as an explanation of the IVOL anomaly.
- An explanation for why the returns of high IVOL stocks are so low is that they tend to behave like small-cap growth stocks, with low profitability and high levels of real investment (which have very poor returns).
New Evidence
Percy Poon, Tong Yao and Andrew Zhang contribute to the literature on both the beta and IVOL anomalies with their October 2020 study “The Alphas of Beta and Idiosyncratic Volatility.”
They began by noting:
There is also a recent debate that centers on, between IVOL and beta, which empirical measure better captures the low-risk effect and whether one measure dominates the other in predicting returns.
To help resolve the debate, they examined the relationship between the IVOL anomaly and the BETA anomaly at both short and long horizons. Their database included all NYSE/AMEX/Nasdaq common stocks in the Center for Research in Security Prices (CRSP) database from 1963 to 2018, excluding stock prices below $5, at the beginning of each holding month to mitigate any concerns about market microstructure noises in measuring returns.
Following is a summary of their findings:
- The relation between the IVOL anomaly and the BETA anomaly is different at long horizons than at short horizons.
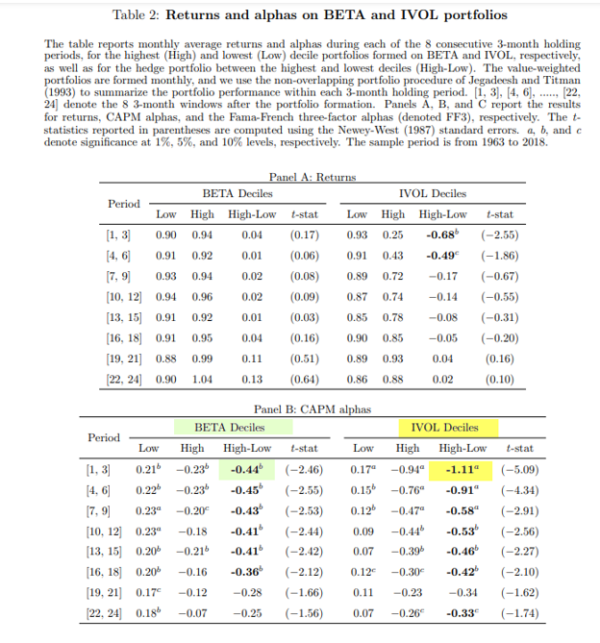
- Both IVOL and BETA negatively predict stock alphas over horizons from a few months to beyond one year. However, the alpha spread for IVOL is much greater in magnitude than the one for BETA in the short run—the CAPM (Fama-French three-factor) alpha spread was -111 bps (-102 bps) on hedge IVOL portfolios during the first three-month interval immediately after portfolio formation versus -44 bps (-42 bps) on hedge BETA portfolios.
- At the short horizon, neither anomaly can fully explain the other. However, the beta anomaly significantly weakens the IVOL anomaly in the short run and fully explains the IVOL anomaly in the long run (beyond six months).
- While the hedge alpha spreads for BETA and IVOL both declined over time, during the post-formation period, the pace was faster for IVOL than for BETA.
- A measure of idiosyncratic volatility over a long window, popularly used by the investments industry to construct low-volatility portfolios, is related to returns and alphas at various horizons in a way similar to that for beta, and its predictive power is mostly explained by beta.
- Overall, IVOL and beta each have unique information about short-term alphas, but at long horizons, the two anomalies appear to be the same.
- IVOL is negatively related to information about corporate earnings during the subsequent two quarters, while beta contains no such information—the short-term return predictive power of IVOL may be due to temporary market underreaction to information about corporate earnings while the beta-alpha-relation is likely of a different nature.
Their findings led Poon, Yao and Zhang to conclude:
“Our findings suggest that low-volatility investing is somewhat different in nature from the short-term IVOL anomaly studied by researchers, in that the popular low-volatility strategies rely on the long-horizon beta-alpha relation.”
They added:
“Our findings help reconcile a perceptional gap between academic studies and the investment industry on low volatility investing and enrich the debate about the relation between the two low-risk anomalies.”
Conclusion
The research findings help us understand the roles that beta and idiosyncratic volatility play in explaining returns. For investors, it is important to note that the findings of more uncorrected overpricing than uncorrected underpricing does not mean a mutual fund has to short an overpriced stock to benefit. The fund can benefit by avoiding the purchase of overpriced stocks by using a filter that screens out stocks with the characteristics which create the mispricing. Passively managed (systematic and transparent), long-only mutual funds can put this knowledge to work by using screens to eliminate stocks that would otherwise be on their eligible buy list.
Additional Disclosure:
This article is for educational and informational purposes only and should not be construed as specific investment, accounting, legal or tax advice. The analysis contained herein is based upon third party data and information and may become outdated or otherwise superseded at any time without notice. Third-party data and information are deemed to be reliable, but its accuracy and completeness cannot be guaranteed. By clicking on any of the links above, you acknowledge that they are solely for your convenience and do not necessarily imply any affiliations, sponsorships, endorsements or representations whatsoever by us regarding third-party websites. We are not responsible for the content, availability or privacy policies of these sites and shall not be responsible or liable for any information, opinions, advice, products or services available on or through them. The opinions expressed by featured authors are their own and may not accurately reflect those of Buckingham Wealth Partners, collectively Buckingham Strategic Wealth® and Buckingham Strategic Partners®. R-20-1535
References[+]
| ↑1 | a simulation study on low-beta stocks is available here. |
|---|
About the Author: Larry Swedroe
—
Important Disclosures
For informational and educational purposes only and should not be construed as specific investment, accounting, legal, or tax advice. Certain information is deemed to be reliable, but its accuracy and completeness cannot be guaranteed. Third party information may become outdated or otherwise superseded without notice. Neither the Securities and Exchange Commission (SEC) nor any other federal or state agency has approved, determined the accuracy, or confirmed the adequacy of this article.
The views and opinions expressed herein are those of the author and do not necessarily reflect the views of Alpha Architect, its affiliates or its employees. Our full disclosures are available here. Definitions of common statistics used in our analysis are available here (towards the bottom).
Join thousands of other readers and subscribe to our blog.