The current workhorse asset pricing model is the Fama-French five-factor model (2015), which added the profitability and investment factors to their original (1992) three factors of market beta, size, and value—increasing the model’s explanatory power.
Nusret Cakici and Adam Zaremba contribute to the factor literature with their May 2021 study, “ Size, Value, Profitability, and Investment Effects in International Stock Returns: Are They Really There?” Using data on 65,000 stocks from 23 countries, they evaluated the performance of the Fama-French factors, examining the factor premia in global markets to verify their robustness across different company size categories and geographical regions. Their data sample covered the period 1987-2019.
Following is a summary of their conclusions:
- The performance of the value, size, profitability, and investment factors depends strongly on the geographical region and period examined.
- The value premium (HML, or high book-to-market minus low book-to-market) for large stocks (90 percent of the market cap) was not statistically significant, at 0.11 per month. However, the HML premium in small stocks was statistically significant and much greater, at 0.44 percent per month. Note that this was virtually the same premium observed for the market beta factor (0.45 percent), though of much greater statistical significance (t-stat of 2.5 versus 1.8). Large firms’ value effect was only significant in Japan, where it equaled 0.54 percent per month.
- The profitability (robust minus weak, or RMW) premium was more robust. The mean returns deviated significantly from zero in the Global, North America, Europe, and Asia-Pacific regions, amounting to between 0.24 percent and 0.31 percent per month. In addition, there was little difference in the premium for small stocks (0.26 percent per month) versus big stocks (0.21 percent per month). Interestingly, the profitability premium was not present at all in Japan. For the rest of the Asia-Pacific region, it was present for all but the largest quintile of firms.
- The investment factor (conservative minus aggressive, or CMA) was not as robust as the profitability premium, lacking statistical significance across some geographical regions. However, the mean return per month on CMA ranged from an economically significant 0.17 percent to 0.29 percent. And the mean was statistically significant in the Global and Europe portfolio sets. In addition, in small stocks, the investment premium was 0.37 percent per month compared to 0.11 percent per month for large stocks.
- Premium returns were driven by smaller firms for the value and investment factors, but they were less pronounced for the profitability factor.
- The market factor had the highest cross-region correlation coefficients. The size, profitability, and investment factor returns displayed the lowest correlations. The correlation coefficients for the value effect were high for the Global, North America, and Europe regions, and low for Japan and Asia-Pacific—indicating that asset pricing is at least partially integrated across different global regions.
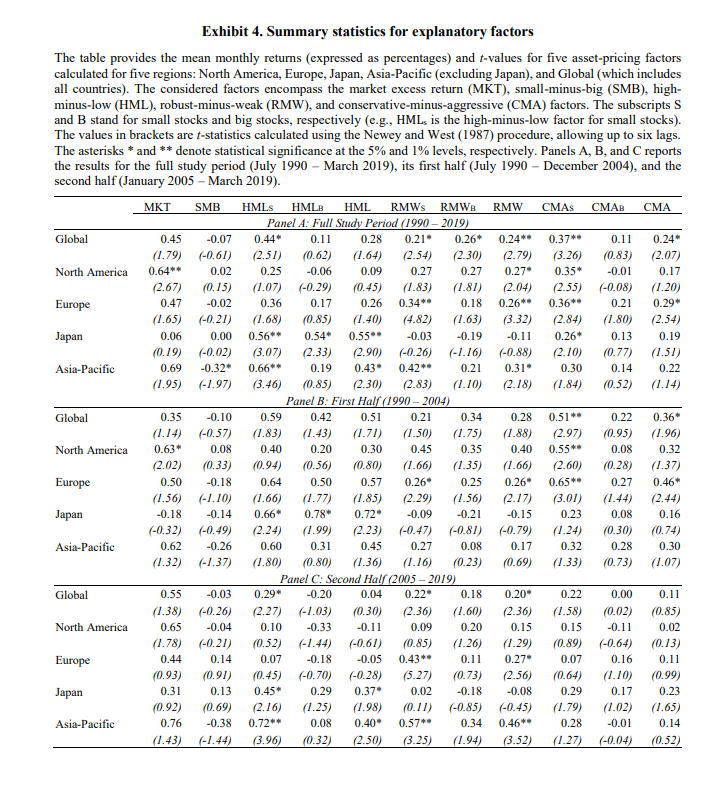
In a test of robustness, they split the full period into two subperiods: July 1990 to December 2004 and January 2005 to March 2019. They found that no factor based on either data sample produced any significant mean profit—in no case did the HML, RMW, or CMA mean returns depart significantly from zero. That could be at least partially explained by the relative shortness of the subperiods.
Their findings led Cakici and Zaremba to conclude:
“Our evidence casts doubt on the reliability of factor premia among the large firms, which constitute the vast majority of the equity market.”
Their findings are consistent with prior research, which has found that factor premiums are much larger in smaller stocks where limits to arbitrage play a greater role.
Investor Takeaways
One takeaway for investors is that if you are going to seek exposure to the Fama-French factors, consider concentrating that exposure in smaller stocks (other side of that story is here and here). For example, the global value premium in the smallest quintile of stocks was 0.78 percent per month (t-stat = 3.4), while in the largest quintile it was just 0.07 percent per month (t-stat = 0.34). That has implications for fund selection. In addition, because trading costs are greater in smaller stocks when choosing a fund, you should have a preference for one that trades patiently—it doesn’t have to slavishly trade to eliminate tracking variance to an index and avoids the high turnover typically found in actively managed funds. Investors should also consider that another benefit of “going small” is that the correlations of returns have been the lowest for the size factor—the largest benefit of international diversification comes from small stocks.
Important Disclosures
The information presented herein is for educational purposes only and should not be construed as specific investment, accounting, legal or tax advice. Certain information may be based on third party data which may become outdated or otherwise superseded without notice. Third party information is deemed to be reliable, but its accuracy and completeness cannot be guaranteed. Indices are not available for direct investment. Their performance does not reflect the expenses associated with the management of an actual portfolio nor do indices represent results of actual trading. Performance is historical and does not guarantee future results. By clicking on any of the links above, you acknowledge that they are solely for your convenience, and do not necessarily imply any affiliations, sponsorships, endorsements or representations whatsoever by us regarding third-party Web sites. We are not responsible for the content, availability or privacy policies of these sites, and shall not be responsible or liable for any information, opinions, advice, products or services available on or through them. The opinions expressed by featured authors are their own and may not accurately reflect those of the Buckingham Strategic Wealth® or Buckingham Strategic Partners® (collectively Buckingham Wealth Partners). LSR-21-101
About the Author: Larry Swedroe
—
Important Disclosures
For informational and educational purposes only and should not be construed as specific investment, accounting, legal, or tax advice. Certain information is deemed to be reliable, but its accuracy and completeness cannot be guaranteed. Third party information may become outdated or otherwise superseded without notice. Neither the Securities and Exchange Commission (SEC) nor any other federal or state agency has approved, determined the accuracy, or confirmed the adequacy of this article.
The views and opinions expressed herein are those of the author and do not necessarily reflect the views of Alpha Architect, its affiliates or its employees. Our full disclosures are available here. Definitions of common statistics used in our analysis are available here (towards the bottom).
Join thousands of other readers and subscribe to our blog.