Outperforming the market, before expenses, is a zero-sum game—if one group of active investors outperforms, another group of active investors must underperform. Is there a group of sophisticated investors who persistently exploit more naïve investors? The body of research has found that before expenses, as a group, institutional investors outperform. For example, in his study “Mutual Fund Performance: An Empirical Decomposition into Stock-Picking Talent, Style, Transactions Costs, and Expenses” Russ Wermers found that the stocks active mutual fund managers selected outperformed by 0.7 percent per annum. In this zero-sum game before expenses, who is on the other side of institutional trades?(1)
The field of behavioral finance has produced a large body of evidence on the poor performance of individual investors, resulting in their being referred to as naïve or “dumb money”. For example, Brad Barber and Terrance Odean have performed a series of studies on retail investors, including “Trading Is Hazardous to Your Wealth: The Common Stock Investment Performance of Individual Investors” and “Too Many Cooks Spoil The Profits: Investment Club Performance,” demonstrating that the stocks individual investors buy tend to underperform on average, and the ones they sell go on to outperform—on average, they are the proverbial suckers at the poker table who don’t know they are the suckers. There is also a large body of evidence demonstrating that retail investor sentiment can skew the demand for securities, which in turn causes prices to deviate from their fundamentals—institutional investors are less susceptible to behavioral biases and are thus considered to be more sophisticated investors.
The behavior of “dumb money” has led to the existence of many anomalies (at least for asset prices models such as the CAPM and the Fama-French three- (beta, size, and value) and Fama-French five-factor (beta, size, value, investment, and profitability) models that have persisted well after the publication of the findings. In their 2017 study “Mispricing Factors,” Robert Stambaugh and Yu Yuan identified 11 of them:
- Failure Probability: Stocks with a high probability of failure have lower future returns.
- O-score: Stocks with higher O-scores (a higher probability of bankruptcy) have lower future returns compared to stocks with lower scores.
- Net Stock Issuances: The stocks of firms that issue equity underperform the stocks of non-issuers.
- Composite Equity Issuance: Firms with higher equity issuance underperform firms with lower measures.
- Accruals: Stocks with high accruals underperform stocks with low accruals.
- Net Operating Assets: Stocks with higher net operating assets underperform stocks with lower net operating assets.
- Momentum: Stocks with higher past performance outperform stocks with lower past performance.
- Gross Profitability: Stocks with higher gross profitability have higher future returns.
- Asset Growth: Stocks with higher asset growth have lower future returns.
- Return on Assets: Stocks with a higher return on assets have higher future returns.
- Investment-to-Assets: Stocks with higher past investment (scaled by total assets) have lower future returns.
That anomalies, such as the poor performance of equities with lottery-like distributions (such as penny stocks, IPOs, stocks in bankruptcy, and small growth stocks with high investment and low profitability) can persist is attributed to what is referred to as “limits to arbitrage” which can prevent sophisticated investors from fully correcting mispricings. The “limits-to-arbitrage” literature provides several explanations for why the anomalies may not completely vanish:
- Many institutional investors (such as pension plans, endowments, and mutual funds) are prohibited by their charters from taking short positions.
- Shorting can be expensive. You have to borrow a stock to go short and many stocks are costly to borrow because supplies of available stock from institutional investors are low. The largest anomalies tend to occur in small stocks (which are costly to trade in large quantities, both long and especially short) because the share volume available to borrow is limited and borrowing costs are often high. In other words, market frictions prevent prices from being fully corrected.
- Investors are unwilling to accept the risks of shorting because of the potential for unlimited losses. Even traders who believe that a stock’s price is too high know that they can be correct in the long term (the price may eventually fall) but still face the risk that the price will go up in the short term before it eventually goes down. Such a price move, requiring additional capital, can force the traders to liquidate at a loss.
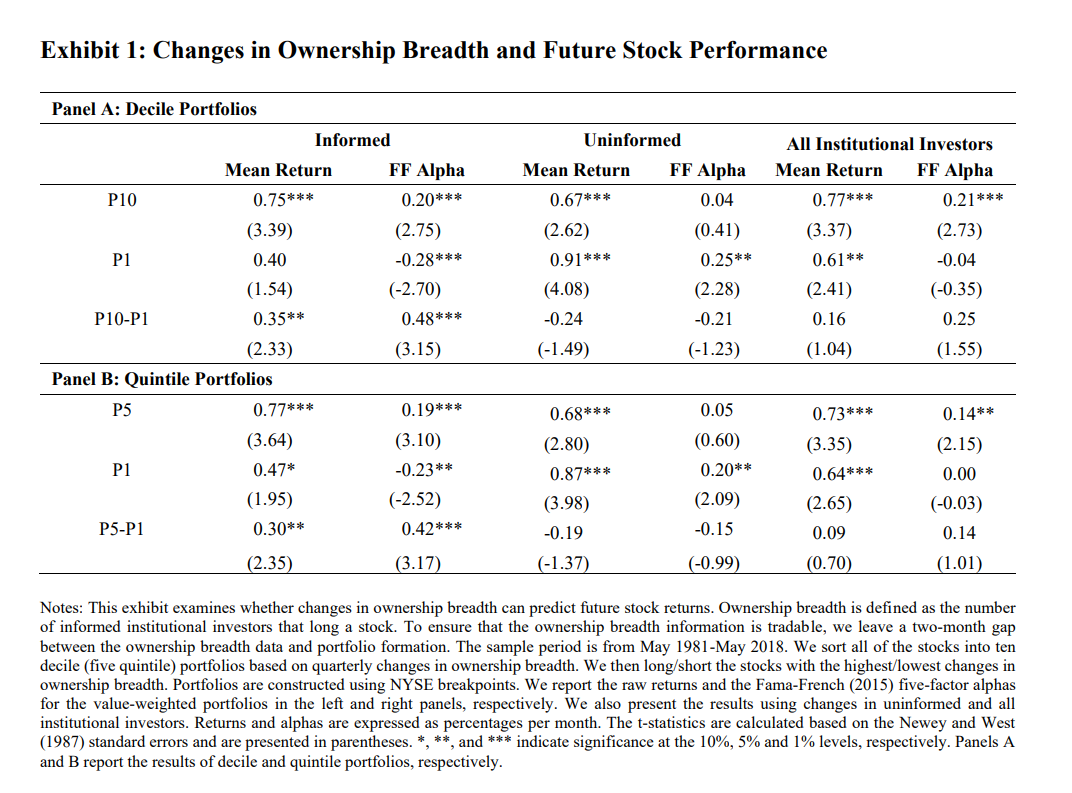
An interesting question is do the trades of the more sophisticated institutional investors against anomalies provide information on returns? To answer that question, Yangru Wu and Weike Xu, authors of the study “Changes in Ownership Breadth and Capital Market Anomalies,” published in the February 2022 issue of The Journal of Portfolio Management, examined whether the entries and exits of informed institutional investors (or ownership breadth changes) interact with the aforementioned 11 anomaly signals studied by Stambaugh and Yuan can be used to improve the performance of anomaly-based strategies. They explained that they emphasized institutions’ new entries and exits because they could be triggered by private information and correlated with future earnings news, thereby capturing useful information regarding future stock returns. To determine if the trades of the institutional investors were informed, they sorted all stocks into 10 decile portfolios based on quarterly changes in ownership breadth. Their data sample covered all NYSE/AMEX/Nasdaq common stocks from May 1981 to May 2018. Following is a summary of their findings:
- The long legs of anomalies earn more positive alphas following institutional entries, whereas the short legs earn more negative alphas following their exits.
- The long leg of the 11 anomalies, on average, delivers a significant Fama and French (FF) five-factor alpha of 26 basis points (bps) per month in the top breadth-changes tercile versus an alpha of 11 bps per month for the same anomalies—an improvement of 15 basis points a month. Similarly, the short leg of the 11 anomalies produced a significant FF alpha of −59 bps in the bottom breadth-changes tercile while the short leg of the 11 original anomalies generated an FF alpha of −17 bps—an improvement of 42 bps per month.
- On average, the 11 enhanced anomalies earned a significant average return of 67 bps per month, an improvement of 28 bps per month from the mean return of the original anomalies—a more than 70 percent increase.
- The enhanced strategy delivered an average annualized Sharpe ratio of 0.49, substantially higher than that of the original anomalies (0.37).
- The enhanced strategies increased the FF alphas by large margins, ranging from 19 bps per month (from 58 to 77 bps) for the failure probability anomaly to 54 bps (from 45 to 99 bps) for the operating accruals anomaly. Furthermore, although the FF alphas were significant at the 5 percent level for only 5 of the 11 original anomalies, they were significant for all but one enhanced strategy.
- The entries and exits of informed institutional investors were significantly positively correlated with future earnings surprises and predict future stock returns, explaining the alphas generated.
Their findings led Wu and Xu to conclude:
“The performance of the long legs of anomalies greatly improves following the entry of informed institutional investors, whereas the performance of the short legs becomes more negative following the exit of investors.” They added: “These results demonstrate that informed institutional investors may possess private information on future earnings and that their entries or exits provide useful signals about future price changes.”
Summary
Wu and Xu’s findings demonstrate that simple strategies using informed institutional trading could improve the performance of systematic strategies that seek to exploit the original anomalies as the returns of their enhanced strategies were largely unexplained by the Fama and French five-factor model. They also provided the economic insight regarding why the entries and exits of informed institutional investors could improve the profitability of the anomalies—ownership breadth changes capture informed trading and future earnings surprises which provide the alpha.
When considering these findings remember that while before expenses active management is a zero-sum game, after expenses it is a negative-sum game. Demonstrating this point, in the aforementioned study “Mutual Fund Performance: An Empirical Decomposition into Stock-Picking Talent, Style, Transactions Costs, and Expenses Russ Wermers found that despite their ability to identify stocks that would outperform by 0.7 percent per annum, their expenses ratios (0.8 percent), trading costs (0.8 percent), and the drag created by cash holdings (0.7 percent) far exceeded the benefits. Active investing was a loser’s game for both institutional and individuals.
With that in mind, fund managers, using systematic strategies, could utilize the information provided by institutional trades without increasing costs. For example, they could delay buying stocks that are in the long leg of an anomaly that enters their eligible universe if institutional investors are decreasing their ownership. Similarly, they could delay selling stocks that have exited their eligible universe if institutions are increasing their ownership. In either case, turnover would be reduced, lowering transaction costs, while also enhancing tax efficiency. This is how fund companies using systematic strategies (such as Bridgeway, Dimensional, AQR, or Alpha Architect) employ momentum strategies (a high turnover strategy) without increasing costs. It will be interesting to see if fund families implement the insights gained from Wu and Xu’s paper.
Important Disclosures:
For informational and educational purposes only and should not be construed as specific investment, accounting, legal, or tax advice. Certain information is based upon third party data and may become outdated or otherwise superseded without notice. Third party information is deemed to be reliable, but its accuracy and completeness cannot be guaranteed. Mentions of specific fund companies are for informational purposes only and should not be construed a specific recommendation of their securities. By clicking on any of the links above, you acknowledge that they are solely for your convenience, and do not necessarily imply any affiliations, sponsorships, endorsements or representations whatsoever by us regarding third-party websites. We are not responsible for the content, availability or privacy policies of these sites, and shall not be responsible or liable for any information, opinions, advice, products or services available on or through them. Neither the Securities and Exchange Commission (SEC) nor any other federal or state agency have approved, determined the accuracy, or confirmed the adequacy of this article. The opinions expressed by featured authors are their own and may not accurately reflect those of the Buckingham Strategic Wealth® or Buckingham Strategic Partners®, collectively Buckingham Wealth Partners. LSR-22-243
References[+]
| ↑1 | Here is a paper on “Smart money” institutional sentiment |
|---|
About the Author: Larry Swedroe
—
Important Disclosures
For informational and educational purposes only and should not be construed as specific investment, accounting, legal, or tax advice. Certain information is deemed to be reliable, but its accuracy and completeness cannot be guaranteed. Third party information may become outdated or otherwise superseded without notice. Neither the Securities and Exchange Commission (SEC) nor any other federal or state agency has approved, determined the accuracy, or confirmed the adequacy of this article.
The views and opinions expressed herein are those of the author and do not necessarily reflect the views of Alpha Architect, its affiliates or its employees. Our full disclosures are available here. Definitions of common statistics used in our analysis are available here (towards the bottom).
Join thousands of other readers and subscribe to our blog.