What if your portfolio was only based on one idea? Something like “stocks always go up” or “value always beats growth.” You may be learning a humbling lesson right now that Mr. Market has taught us over and over again (and learning it the painful way). In this post, we’ll examine value factor diversification and the various ways value-centric investors can potentially improve their portfolio outcomes by pooling together different ideas.
What we find won’t come as a surprise to readers of this blog: momentum is a great diversifier to value. In fact, we find that avoiding momentum as a diversifying factor in favor of quality is a risky idea on empirical and common-sense grounds.
At the end of this piece, we investigate the idea of putting everything together (i.e. US/International beta/value/quality/momentum) to get the widest factor diversification across a set of unique ideas. As readers of this blog would expect, you end up with something that produces favorable long-term results (but almost everyone will agree the approach has problems).
What do We Know About Long-Only Factors?
We first highlight the horse race between the long-only decile portfolios cut on book/market (“value”), operating profitability/book (“profitability” or “quality”), and 2-12 past return (“momentum”).(1)
We do not focus on long/short factor portfolios in the analysis. Instead, we focus on long-only factor portfolios which consist of one part beta, or generic market risk, and one part factor (or factors). We keep the analysis focused on long-only factors because this more closely aligns with how investors implement factors in practice. Long/short factors are by no means “boring” and can be used to potentially enhance the results below to an even greater degree. Nonetheless, we keep things simple in this post.
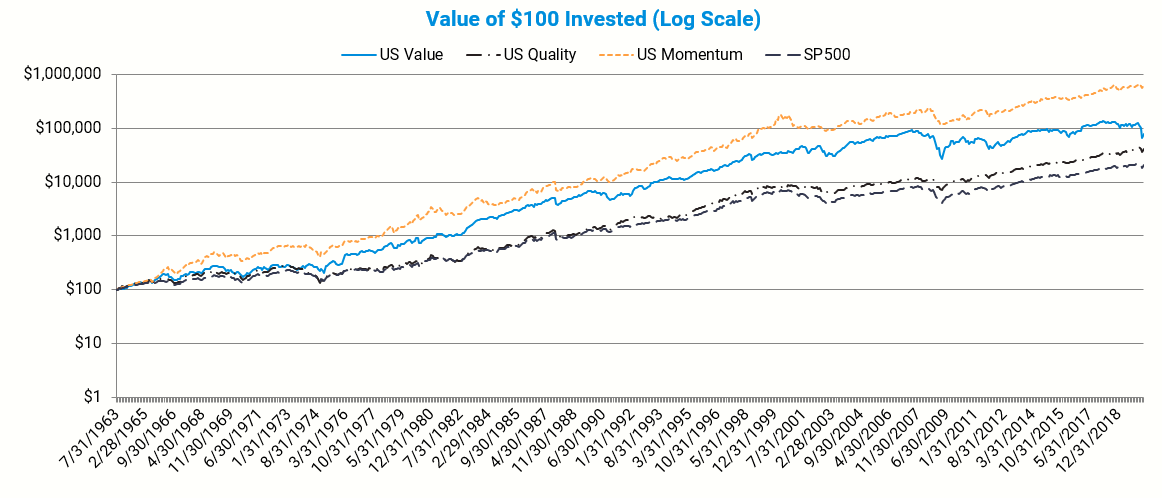
Here is the invested growth chart on the long-only strategies:
And here is a comparison of your basic statistics, which are defined below:
- CAGR: Compound annual growth rate
- Standard Deviation: Sample standard deviation
- Sharpe Ratio (annualized): Average monthly return minus treasury bills divided by the standard deviation
- Worst Drawdown: Worst peak to trough performance (measured based on monthly returns)
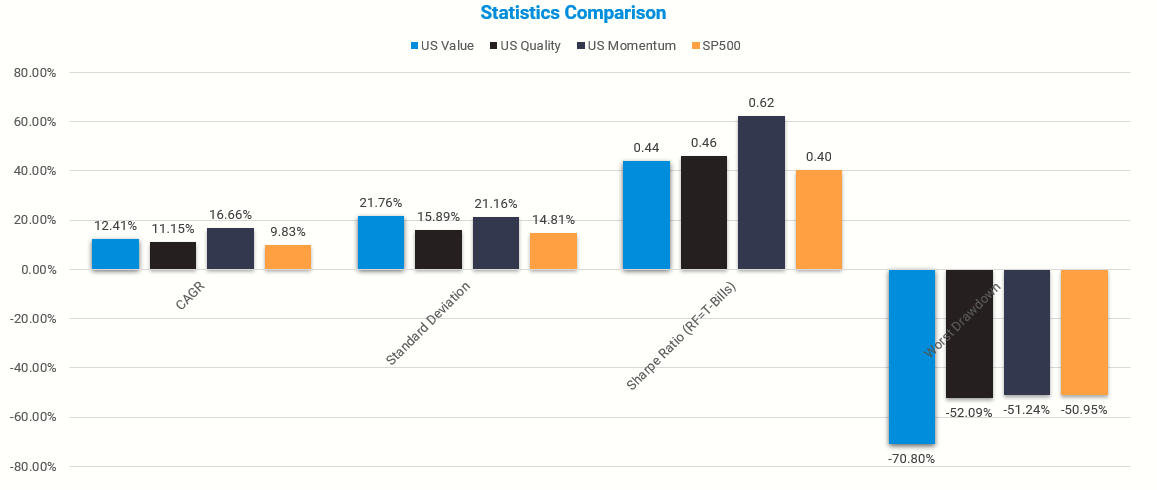
To summarize:
- Value works. Arguably the worst-performing factor with decent returns but extreme risk and drawdowns.
- Momentum works. Momentum is the best performing factor on a risk-adjusted metric, but the absolute volatility is extreme and on-par with value.
- Quality works. Profitability is solid on a risk-adjusted basis, but essentially looks and feels like the market on absolute risk and return measures.
Stocks Seem to Work. What about Correlations?
The good news for investors is that we don’t necessarily need to go all-in on a single factor. We could own different things and hope that the structural difference in the underlying bets helped smooth the ride on our portfolio (yay factor diversification!).
For example, on the simple end of things, we could pair our book/market-based value strategy with another value strategy (e.g., EBIT/TEV or cash flow/price). Intuitively, we probably won’t gain much via this construct (and we may just confuse ourselves!) because we are basically piling a value strategy on top of a value strategy. We could also look at pooling value with quality which seems like a more sensible way to diversify our portfolio (versus simply piling on more value). Or we could go for a more extreme setup and pool value with its arch-nemesis — momentum.
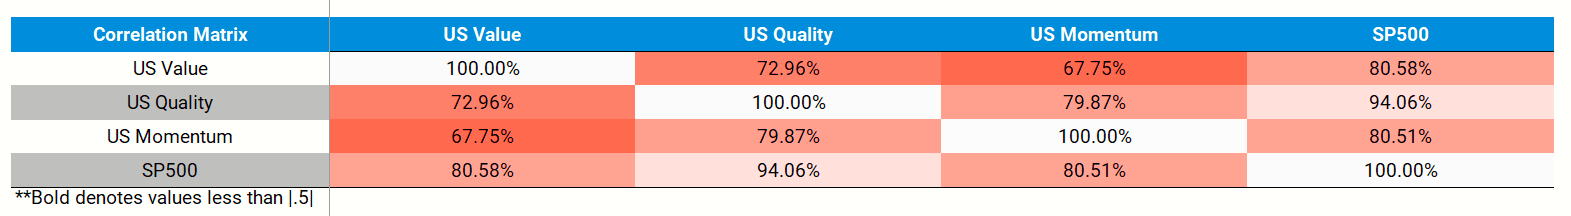
Let’s look at the data and see what correlations say about the matter.
Below is the correlation matrix on the long-only factors. Value is most correlated with the market, which makes sense since market beta drives most of the variance on long-only portfolios (even decile factor portfolios!). Value is less correlated with profitability (great!) and has an even lower correlation with momentum (even better). Portfolio 101 would suggest that combining value with profitability would be a good idea and pooling value with momentum would be an even better idea.
The results are hypothetical results and are NOT an indicator of future results and do NOT represent returns that any investor actually attained. Indexes are unmanaged and do not reflect management or trading fees, and one cannot invest directly in an index.
Let’s look at the generic stats on the various 50/50 combos that mix and match value, value and quality, and value and momentum.
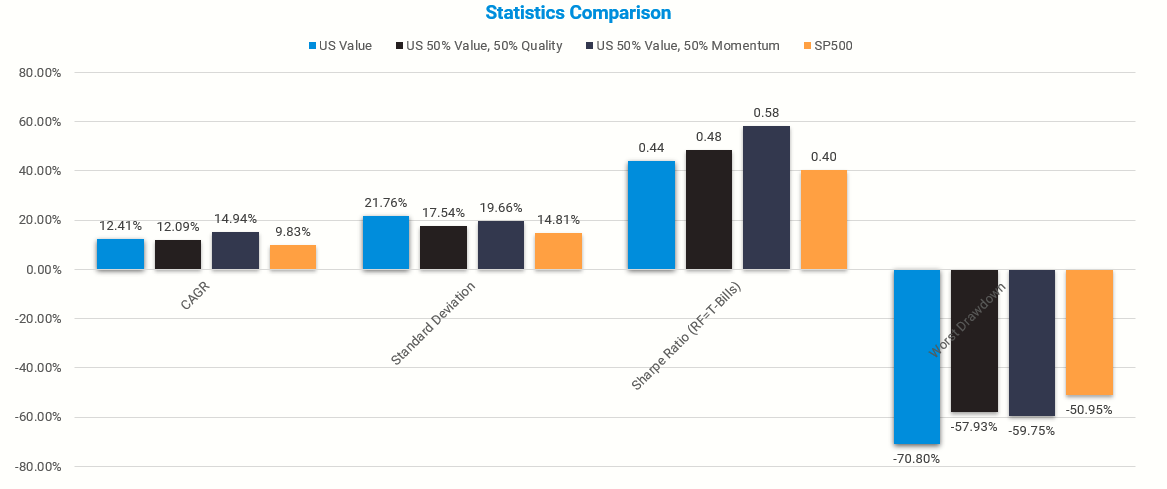
Combining the value metric with quality was certainly better on a risk-adjusted basis (e.g., Sharpe Ratio) than being wed to value. Of course, the real winner here is the one we would expect to win based on our understanding of portfolio theory — pooling value with momentum. This simple portfolio has the best risk-adjusted performance and arguably gains the most from factor diversification.
How about the relative performance of these 50/50 combo portfolios versus the generic market? In theory, investors are supposed to create portfolios that don’t consider relative performance to a benchmark as a risk factor. Of course, outside of alien life forms, normal people are actually influenced by short-run fluctuations in performance on their portfolios (i.e., losing out to the S&P 500 for 5 years in a row might cause you to jump off a bridge).
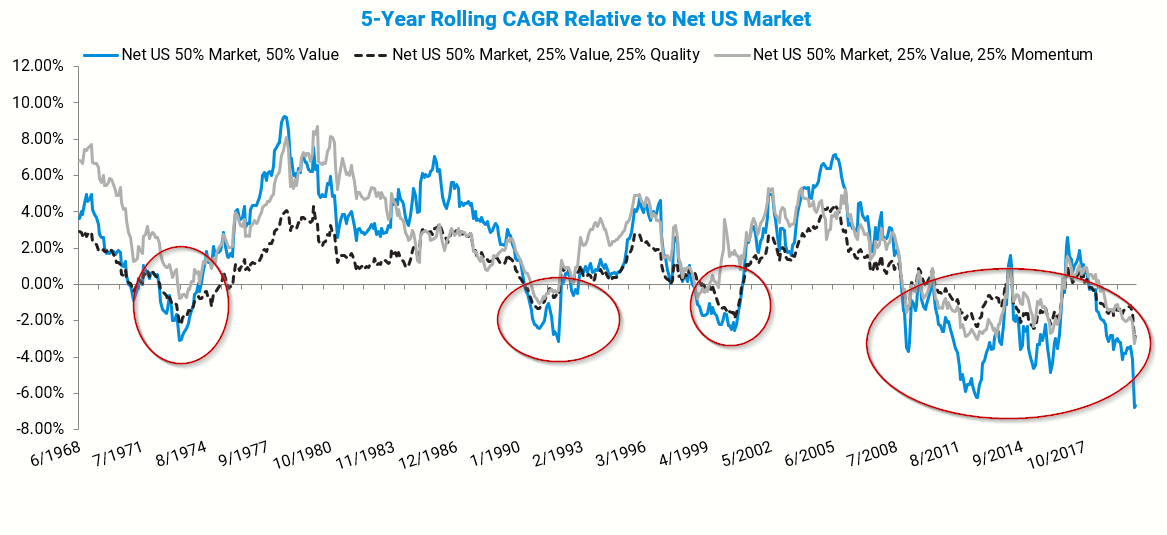
Here are the 5-year relative rolling CAGRs on the generic b/m portfolio and several of the combos.
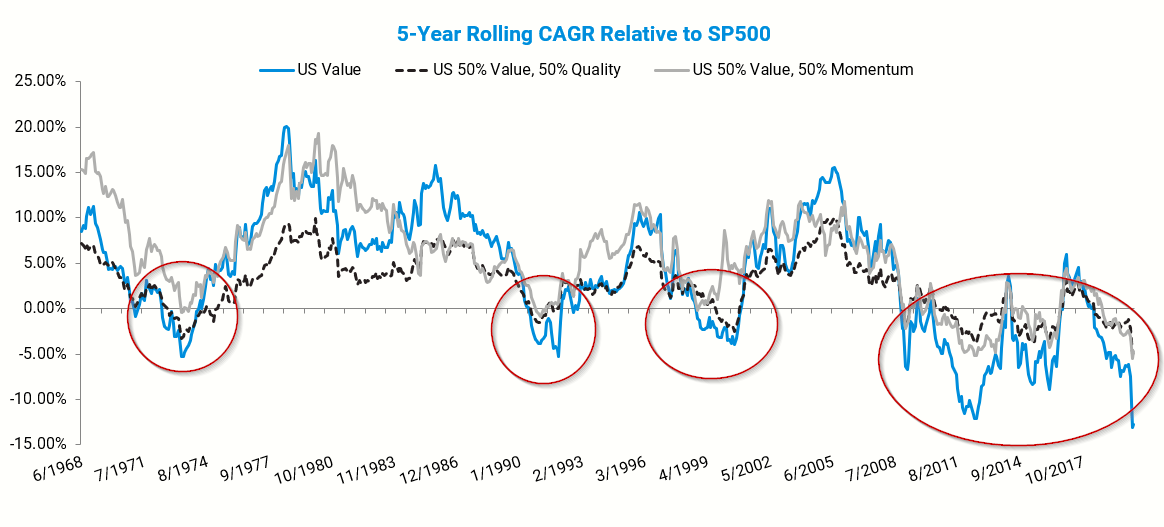
The circles highlight periods when there was a 5-year relative underperformance period for the different strategies. Unfortunately, there are quite a few of these situations. The deeper the line wiggles south, the more likely you were extremely frustrated as an investor (or fired if you were an intermediary investing in these different strategies).
The most important aspect about factor diversification to note is that being all-in on value is borderline suicidal. The value and quality combo (dotted black line above) is certainly a nicer way to play the factor investing game: The results during bomb-out value periods are generally better than being pure value, but not always. When we look at the value and momentum combo, we see an even cleaner relative performance path. The value/momentum combo keeps you alive in the early 70’s, 90’s, and late 90’s, but doesn’t help much relative to the value/profitability combo in the more recent factor debauchery.
Clearly, there is no perfect solution for a factor investor. But this is good news. A core reason why factors may earn higher expected returns in the future is that they are not easy to own in the short-run. If we could generate portfolios that were easy to own, one can be certain that those portfolios would be unlikely to deliver similar results in the future (the market may not be efficient, but it is certainly competitive!).
Great. But I don’t do Pure Factors. I run Core-Satellite Portfolios.
The analysis above makes a bold assumption that investors and their advisors are in for the long-game, could care less about the S&P 500 performance in the short-run, and simply want to compound their face-off over 20 years periods. In short, only Alpha Architect employees and perhaps 3 or 4 other humans on the planet favor that approach. For the rest of society, your equity portfolio is probably going to pool these long-only factor portfolios alongside a core position in some passive equity index like the S&P 500. This approach is often referred to as a core-satellite approach (see here for more explanation). Below we conduct some basic analysis on this concept using the tools we’ve already discussed.
Let’s first look at our baseline stats comparing the S&P 500 against a portfolio that is 50% SP500/50% value, 50% SP500/25% value/25% quality, and 50% SP500/25% value/25% momentum.
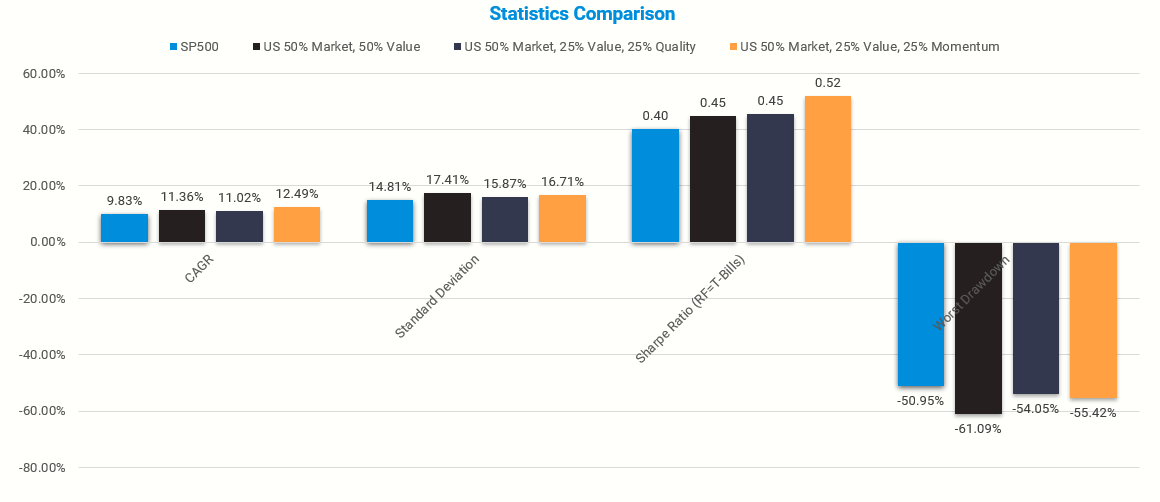
The SP500 delivers what we all know and love about the US stock market — around 10% a year with nasty 50%+ drawdowns and around a 0.4 sharpe ratio.
Adding value to the mix certainly improves your returns (e.g., CAGR) a bit (11.36% vs 9.83%) but that comes with some heavier drawdowns (-61.09% vs -50.95%) and volatility (17.41% vs 14.81%).
Throw some value and quality on the core SP500 portfolio and things get marginally better than simply adding value to the SP500 (at least on a risk-adjusted Sharpe Ratio basis).
Finally, our personal favorite of throwing a focused value and momentum portfolio on top of the passive SP500 core position is the seemingly best way to improve your expected outcomes (at least from a historical perspective).
Last but not least, let’s examine the career risk profile of these different core-satellite portfolios. If you remember, the primary reason to run a core-satellite portfolio is to placate the reality that most investors can’t handle being too different from a widely watched benchmark like the S&P 500. The simple solution to this problem is to make the benchmark a core holding — you can’t underperform the benchmark if you are the benchmark…magic!
To get a quick peek at career risk in the context of core-satellite portfolios, we pull out our 5-year rolling CAGR chart referenced earlier. Again, if we are below the line, we have underperformed the benchmark over a 5-year period — not good, and to many investors, a fireable offense. (If we are above the line we are obviously proud of ourselves).
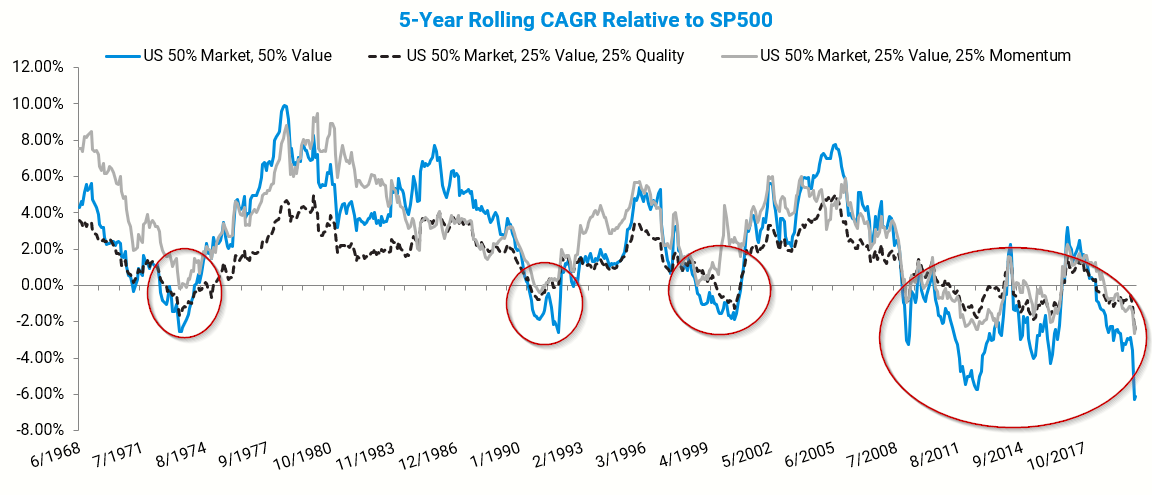
Similar to our career risk review in the analysis prior to this section, we see a similar, but muted career risk story here. A pure SP500/value approach has relatively low benchmark risk compared to a pure value approach, but the opportunity to get fired as the portfolio manager is still very high. Fortunately, bolting on a sleeve of quality to your core-satellite portfolio helps smooth the relative performance ride, but there are still multiple opportunities to earn a pink-slip. Finally, the core-satellite approach that couples a core SP500 position with a value/momentum combo portfolio minimizes career risk and would theoretically allow investors to stay in their seats the longest (and hopefully benefit from the use of factors).
Yeah, but Momentum is Too Expensive to Trade and the Taxes Kill Your Returns.
The simple analysis above highlights that value investors arguably have the most to gain from a performance — and career risk — perspective by leveraging momentum as a primary factor diversification vehicle versus profitability (or as we’ll see at the end, use both!). Portfolio theory and empirical data hath spoken.
That said, we can’t eat hypothetical backtested returns. We can merely look at the pretty charts they create. However, we can explore some of the ridiculous assumptions we’ve made throughout the analysis, to include the assumption of zero frictional costs. This assumption is insane because Uncle Sam always wants his performance fee in the form of taxes, and asset managers can’t afford their yachts if customers aren’t paying them fees. And we can’t forget transaction costs: liquidity isn’t free and market makers, as a stereotyped group, are the most cutthroat economic-freedom-loving group I’ve ever run across in my entire life.(2)
So let’s tackle the taxes, management fees, and trading costs real quick.
We’ll make the following quick and dirty assumptions:
- Taxable investor.
- We invest via ETF wrappers, so we assume there are no capital gains distributions associated with portfolio turnover, only income distributions. If we are dealing with mutual funds, tag on an additional 40-80bps in tax drag.
- We will assume that the taxable income distribution component of total returns (i.e., dividends) are as follows: value~quality>SP500>momentum. This assumption is based on the fact that value/quality type firms typically have higher dividend yields than the broad market and much higher yields than your typical momentum portfolio (which has a yield that is much lower than the market, on average).
- SP500: 70bps total — 60bp tax drag(3), 5bp fee drag, 5bp trading cost drag
- Value: 178bps total — 108bp tax drag(4), 50bp fee drag, 20bp trading cost drag
- Quality: 178bps total — 108bp tax drag(5), 50bp fee drag, 20bp trading cost drag
- Momentum: 206bps total — 36bp tax drag(6), 50bp fee drag, 120bp trading cost drag
With some back of the envelope transactions cost in hand, let’s replicate the figures from above.
First, the generic statistics:
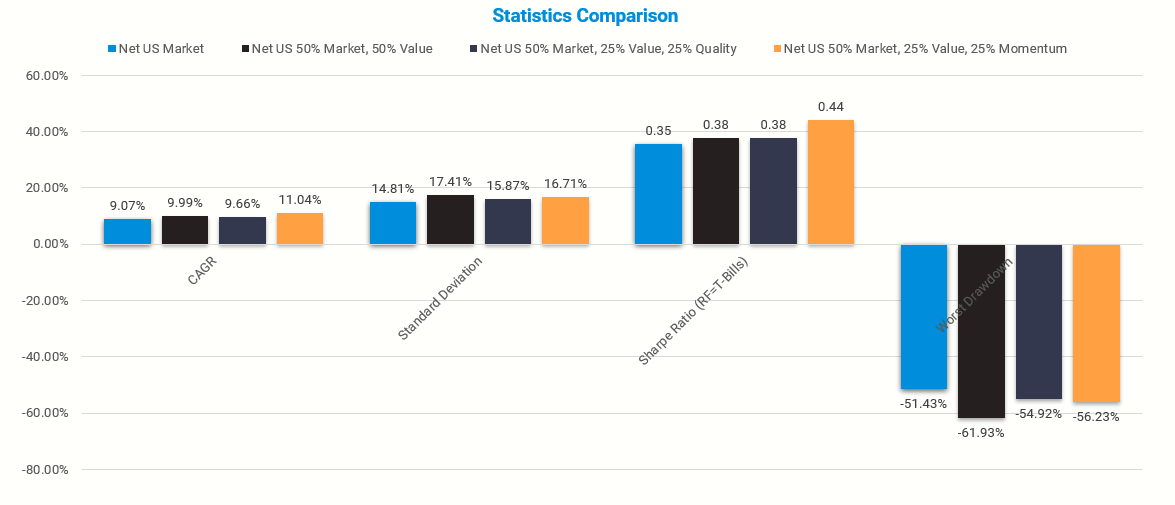
Sheesh. Frictional costs are such a drag. Everything takes a hit and now it is unclear if running a core-satellite with value, or with value/quality, even makes sense. The SP500 plus value/momentum satellite is still interesting, but the overall benefit is muted versus the results when there are no frictional costs. If we were to pile on even more frictional costs, at some costs level we might consider channeling our inner Jack Bogel and punting on everything.
Next, the career risk charts for completeness’ sake:
No real change here. Costs drag everyone down, but the overall pattern from the prior analysis remains: the core-satellite combo of core + value/momentum seems to be the least painful way to play the US factor game.
Wrapping Up on Factor Diversification
The factor diversification analysis above is meant to be simple, easy to replicate, and practical for investors who use factor products and think about portfolio construction. There are levels upon levels of complexity we could add to the discussion above. For example, what about combining even more factors? What happens when we add bonds into the portfolio? What if fees are lower/higher than expected? What if factors don’t even work? What if, what if, what if? You can what-if yourself to death at some point. In the end, if the investment story/thesis can’t be explained to a 5th grader and something simply doesn’t “smell right” about the situation, then there is probably a missing piece of information or a lack of understanding along the way.
We think the following principles make sense for factor investors:
- Know what you own and know why you own it
- Seek opportunities for factor diversification
- Build portfolios that are realistic, not hyper-rational (i.e., nobody benefits if behavioral baggage short-circuits discipline)
- Manage fees and taxes
We hope this was helpful and we encourage you to explore these factor diversification ideas on your own. Enjoy!
Appendix
We provide some additional analysis in this section for the reader who is looking for a bit more depth.
What About International Markets?
Testing ideas on additional samples is generally a sound idea, even if the sample is short and the data aren’t perfect. Case in point: international equity markets. For this analysis, we need to rely on our own factor library (which is free!) to address this question since the decile factor data aren’t easily available from Ken French’s site.
We run the international tests on the decile portfolios cut on book/market (value), profitability (quality)(7), and momentum, using the full available sample of January 1, 1992 through May 31, 2020. EAFE is the MSCI EAFE Index and what we use as the benchmark “market” for this analysis.(8)
First, the summary stats on the international factor horse race:
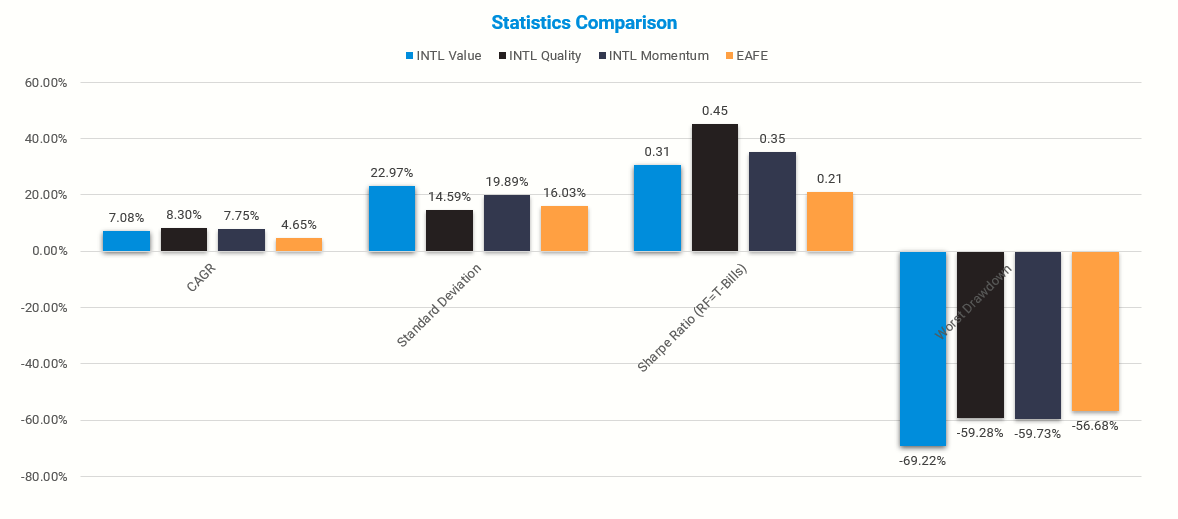
International investing as a whole has not been that exciting relative to the US market experience (i.e., S&P 500 returns are 9.29% over this period vs. 4.65% on MSCI EAFE). On the factor front, we see mostly the same thing that we saw from the US analysis, save the fact that momentum isn’t a clear winner — quality is the performance rock-star of the show!(9) Value sits in last place in the factor race, but not by much. The good news for factor investors is that all the strategies beat the broad market index over the full sample (under the assumption these brave souls could stomach the extra volatility and bouts of terrible relative performance). A more important question for our current discussion is how these different factor strategies are related and their potential to improve portfolio outcomes via diversification.
Here is the correlation table:
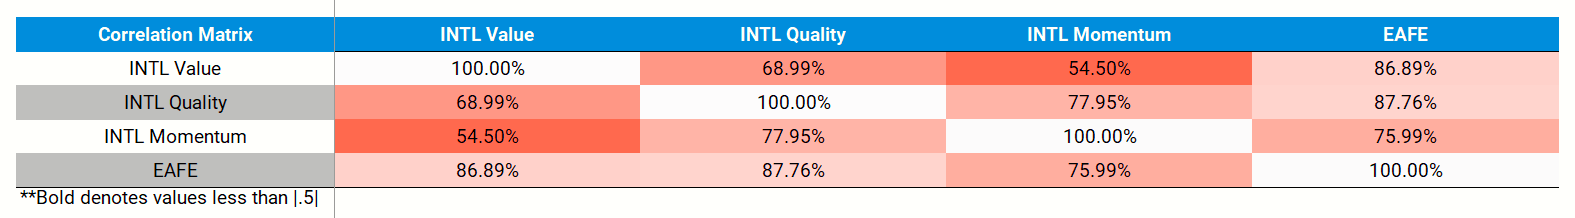
Wow, these results surprised me a bit because I spend a lot more time looking at US-centric factor statistics where long-only portfolios have much higher correlations, in general. The international evidence suggests that there may be a compelling opportunity to diversify across long-only factor portfolios. Value and quality portfolios have the highest correlation to the market, and momentum has the lowest correlation to the market. Among the factors, both quality and momentum seem to be fairly uncorrelated with value. Music to a portfolio theorist’s ears!
We can further investigate this theory and look at the 5-year relative rolling performance chart of the various factors — the best way to gauge the risk that an individual will self-mutilate and/or an intermediary will get canned.
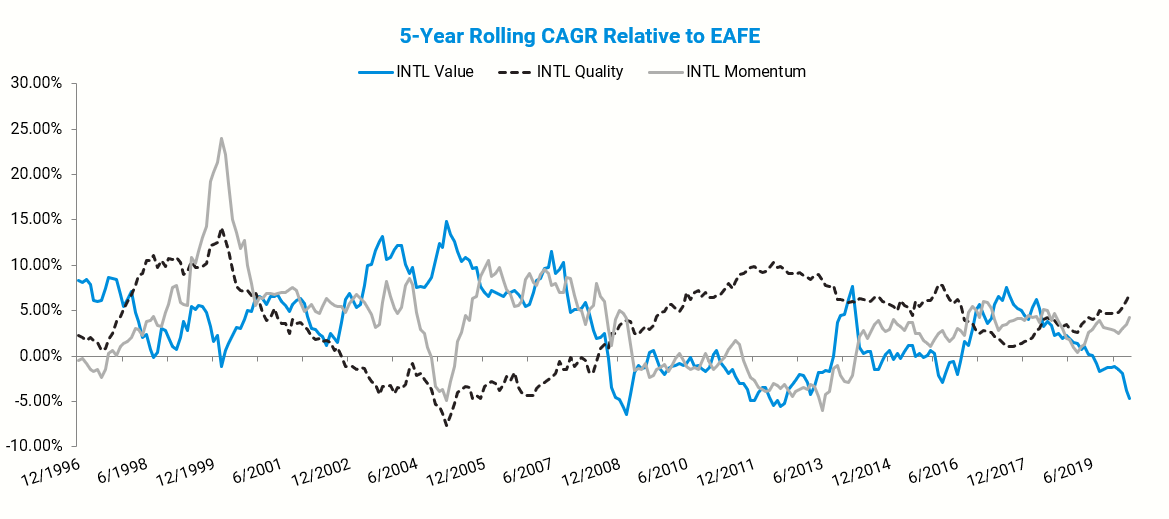
All factors have their moments and would provide a “pure-play” factor investor some excellent opportunities to lose their job. Also, for international markets, quality and momentum both serve as nice partners for a value-centric portfolio, often zig-zagging in different directions, which helps to smooth the ride on a relative basis.
Factor diversification: what’s the “best” combination?
The discussion above has examined value, quality, and momentum as a horse race and we have pitted various combinations against one another — particular value/quality and value/momentum.
Our intuition and the backtested analysis highlight some reasonable concepts to consider:
- Pure value is a solid long term strategy but comes with some tragic career risks
- Pooling different ideas, such as quality and momentum, will lead to a smoother ride for an investor concerned with career risks
- Combining highly differentiated ideas with value may lead to stronger expected diversification benefits
Of course, the tests we performed were somewhat siloed by design. Some obvious questions remain: Why not lean on quality and momentum? Why not invest globally?
These seem like reasonable ideas, let’s do a quick test.
Here is a simple portfolio construct to capture factor and geographic diversification:
- Divvy the allocation across markets: 50% US, 50% International.
- Divvy the factor allocation across the factors: equal-weight value, quality, and momentum.
- Create a global diversified core-satellite factor portfolio:
- 50% passive (25% SP500, 25% EAFE) and 50% factor (8.33% US value, 8.33% US quality, 8.33% US momentum, 8.33% INTL value, 8.33% INTL quality, and 8.33% INTL momentum)
Here are the summary stats on global passive (50% SP500, 50% EAFE) and global factor (25% SP500, 25% EAFE, and equal weight across value/quality/momentum for US/INTL markets). All stats are from 1/1/1992 to 4/30/2020 where we have overlapping data available.
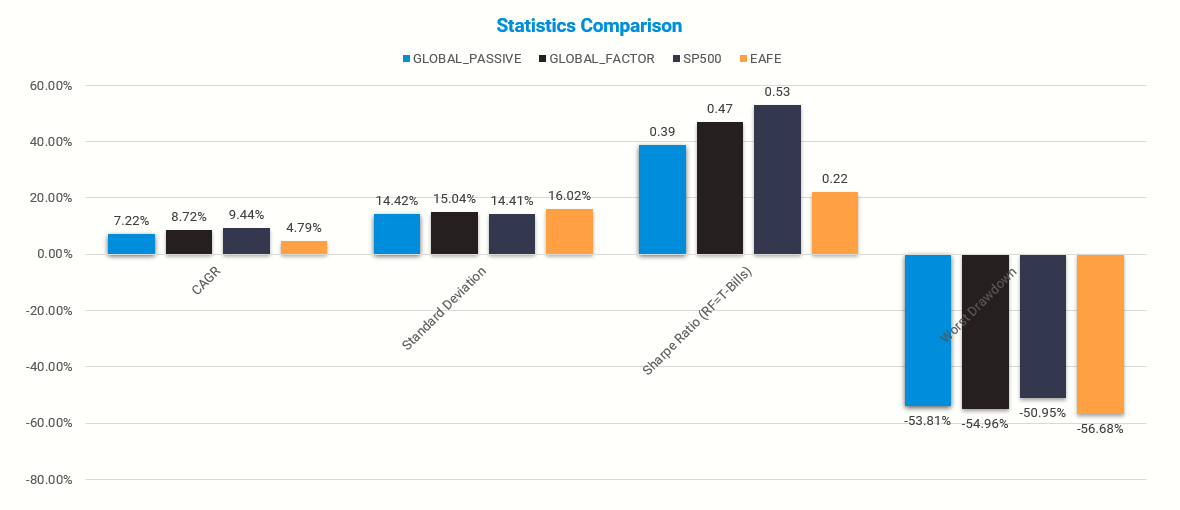
What’s the takeaway? That should be obvious: ditch factors; punt on global factor diversification; and go all-in on the SP500!!!
Kidding aside, let’s pretend we aren’t performance chasers, we believe in factors, and we believe in global factor diversification. The global passive portfolio certainly gets the job done and the global factor portfolio seems pretty reasonable.
What do the career risks look like on the global factor portfolio relative to the global passive portfolio? Let’s check it out.
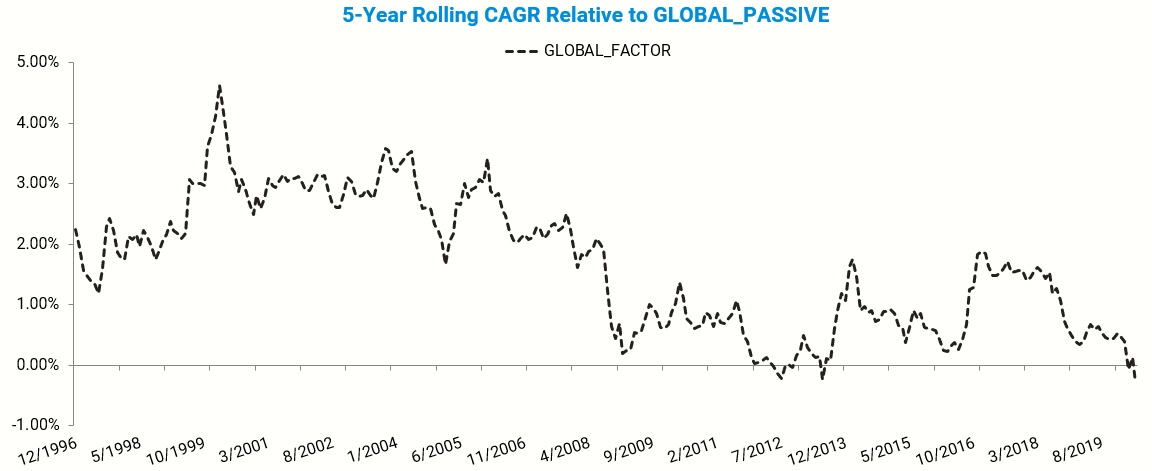
The results are hypothetical results and are NOT an indicator of future results and do NOT represent returns that any investor actually attained. Indexes are unmanaged and do not reflect management or trading fees, and one cannot invest directly in an index.
Not bad. Value has been killing the relative performance in recent memory, but the buoy of momentum (and to a lesser extent quality) are keeping the portfolio alive. Most recently, clients are pissed that they are dragging on the market a bit, but the damage isn’t tragic — for a factor investor, that’s a win!
References[+]
| ↑1 |
Data Details for the NerdsWe collect data on the following porfolios from Ken French’s site (to make it easy to replicate):
All portfolios are value-weighted. That means market-cap-weighted for you non-geeks. All portfolios are indexes. The results are hypothetical results and are NOT an indicator of future results and do NOT represent returns that any investor actually attained. Indexes are unmanaged and do not reflect management or trading fees, and one cannot invest directly in an index. Results are gross of management fees and transaction costs, unless otherwise noted. All returns are total returns and include the reinvestment of distributions (e.g., dividends). The time period analyzed is from 7/1/1963 to 4/30/2020. |
|---|---|
| ↑2 | We all love to hate them for taking their cut, but God bless ’em. |
| ↑3 | I assume 10% total returns, 20% of which are in the form of income, taxed at 30%. SO 10%*20%*30% = 60bps |
| ↑4 | I assume 12% total returns, 30% of which are in the form of income, taxed at 30%. SO 12%*30%*30% = 108bps |
| ↑5 | I assume 12% total returns, 30% of which are in the form of income, taxed at 30%. SO 12%*30%*30% = 108bps |
| ↑6 | I assume 12% total returns, 10% of which are in the form of income, taxed at 30%. SO 12%*10%*30% = 36bps |
| ↑7 | We have gross profits/total assets vs. gross profits/book in our factor database, so close enough |
| ↑8 | All portfolios are value-weighted. That means market-cap-weighted for you non-geeks. All portfolios are indexes. The results are hypothetical results and are NOT an indicator of future results and do NOT represent returns that any investor actually attained. Indexes are unmanaged and do not reflect management or trading fees, and one cannot invest directly in an index. Results are gross of management fees and transaction costs, unless otherwise noted. All returns are total returns and include the reinvestment of distributions (e.g., dividends). |
| ↑9 | This difference is arguably attributable to the sample period since US quality also has a remarkable run from the 1992 –> period. |
About the Author: Wesley Gray, PhD
—
Important Disclosures
For informational and educational purposes only and should not be construed as specific investment, accounting, legal, or tax advice. Certain information is deemed to be reliable, but its accuracy and completeness cannot be guaranteed. Third party information may become outdated or otherwise superseded without notice. Neither the Securities and Exchange Commission (SEC) nor any other federal or state agency has approved, determined the accuracy, or confirmed the adequacy of this article.
The views and opinions expressed herein are those of the author and do not necessarily reflect the views of Alpha Architect, its affiliates or its employees. Our full disclosures are available here. Definitions of common statistics used in our analysis are available here (towards the bottom).
Join thousands of other readers and subscribe to our blog.