In his 2011 presidential address to the American Finance Association, John Cochrane coined the term “zoo of factors,” reflecting concerns about the quality of financial research. How do you separate the signal from the noise? In our book “Your Complete Guide to Factor-Based Investing,” Andrew Berkin and I provided five criteria investors could use to minimize the risk of data mining exercises that reveal correlation without causation. To have confidence that a factor premium, or strategy, isn’t just the result of data mining – a lucky/random outcome – we recommended that you should require evidence that the premium has been not only persistent over long periods of time and across economic regimes, but also pervasive across sectors, countries, geographic regions and even asset classes; robust to various definitions (for example, there has been both a value and a momentum premium using many different metrics); survives transactions costs; and has intuitive risk- or behavioral-based explanations for the premium to persist.
The evidence led us to conclude that only a handful of equity factors met all the criteria: beta, size, value, profitability/quality, and momentum, though low volatility was a close call (our concern was that it had only provided a premium when it was in the value regime). The research team at Verdad, which does great work, has interesting new research on another metric that seems to have provided additional explanatory power to the cross-section of returns: deleveraging. Importantly, deleveraging provides logical benefits, as companies that pay down debt become more resilient to economic shocks, potentially warranting a higher valuation multiple. On the other hand, leverage should be beneficial in good economic times. Before digging into their findings on deleveraging, we’ll do a quick review of their findings on the sources of the value premium.
The Value Factor
Perhaps surprising to many investors, the outperformance of value stocks occurred even though growth stocks produced higher rates of return on assets and equity and faster earnings growth rates. In a series of articles on valuation and earnings growth rates, earnings growth forecasting, and predicting growth, the research team at Verdad provided the explanations for value’s outperformance:
- While growth stocks have produced higher growth in earnings, the persistence of abnormal earnings growth was not greater than would be randomly expected, leading to investor disappointment.
- Analysts’ forecasts systematically overshot the actual outcomes; their forecast errors became larger the further down the income statement (earnings available to equity investors) and the further out in time.
- While analysts have been too optimistic in their growth estimates, they have been able to correctly sort companies into high and low growers. Unfortunately, being able to predict that a company will produce abnormally high earnings growth is a necessary but not sufficient condition for generating excess returns (alpha). The reason is that it is not the forecast that matters, but the forecast relative to what is already priced in—not only have analysts been overly optimistic, but abnormal earnings growth shrinks rapidly. As growth rates mean revert downward, so do valuation multiples. The result is that the benefits of strong growth in the short term are often offset by losses from changes in multiples that reflect the mean reversion of growth in the long term. However, Verdad’s terminal value research showed that valuations have been more persistent than growth. The result is that an expensive company can remain expensive relative to the market, and a cheap company can remain cheap or even get cheaper for years (as value investors experienced during the longest and most pronounced drawdown for the value premium in history, from late 2016 through late 2020, before reversing).
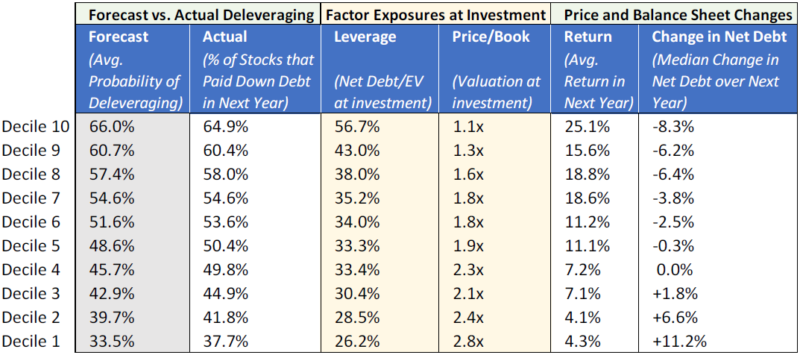
In a 2019 article, “The Signal and the Noise”, Verdad’s research team published their findings from a machine learning algorithm that was trained on 48 years of historical U.S. data to forecast deleveraging among the stocks in their universe. The table below shows the results of an out-of-sample test of this algorithm on European data over the prior 20 years. Among the top decile of leveraged stocks, over a one-year horizon their algorithm was 65 percent accurate in predicting debt paydown over the next year. This is 15 percentage points better than a random guess, as the median stock in their universe had a 50 percent chance of paying down debt.
Out-of-Sample Forecasts of Debt Paydown in Europe (June 1997-December 2017)
The results are hypothetical results and are NOT an indicator of future results and do NOT represent returns that any investor actually attained. Indexes are unmanaged and do not reflect management or trading fees, and one cannot invest directly in an index.
Importantly, they found that stocks more likely to deleverage also have higher returns going forward because they tend to be cheaper and have more debt to pay down at the time of investment. They then examined how their algorithm performed in live trading.
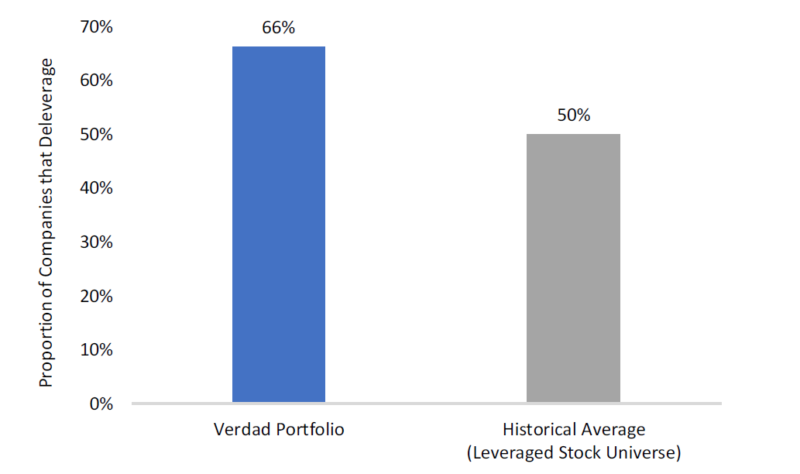
Verdad’s Accuracy at Predicting Debt Paydown (Dec. 2014-Dec. 2018)
The results are hypothetical results and are NOT an indicator of future results and do NOT represent returns that any investor actually attained. Indexes are unmanaged and do not reflect management or trading fees, and one cannot invest directly in an index.
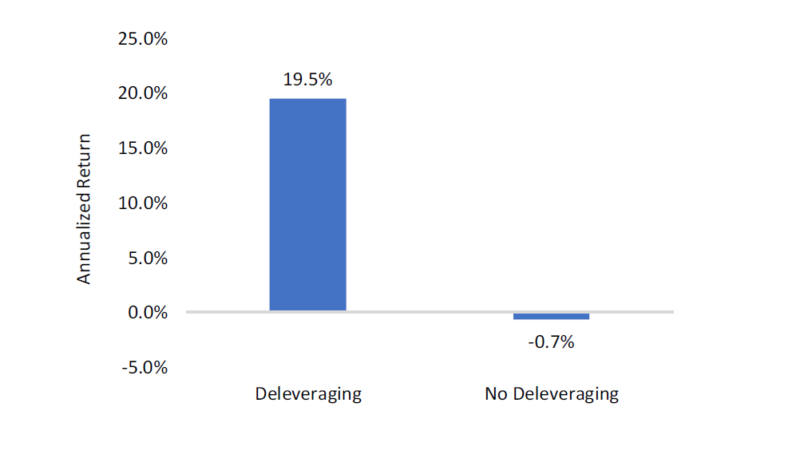
The 66 percent of companies in their portfolio that deleveraged each year was significantly higher than the 50 percent historical average for all levered stocks—a wide margin of improvement versus a random outcome. This is important because the companies in their universe that paid down debt had significantly higher returns than the companies that did not pay down debt.
Annualized Returns of Verdad Portfolio by Deleveraging Category (Dec. 2014–Dec. 2018)
The results are hypothetical results and are NOT an indicator of future results and do NOT represent returns that any investor actually attained. Indexes are unmanaged and do not reflect management or trading fees, and one cannot invest directly in an index.
Their findings led the research team at Verdad to conclude: “We can predict deleveraging with a high degree of accuracy thanks to our machine-learning algorithm. And because deleveraging is a highly significant predictor of future equity returns, this lends a stability to our process—a signal in the noise.” They added: “Predictions that ignore probabilities—such as ‘the market will go down this year’—often fail because they do not account for the substantial amount of uncertainty in returns. On the other hand, predictions that are expressed in probabilistic terms—like ‘these stocks are 65% likely to pay down debt over the next year’—are more likely to succeed because they are informed by base rates and embrace uncertainty.”
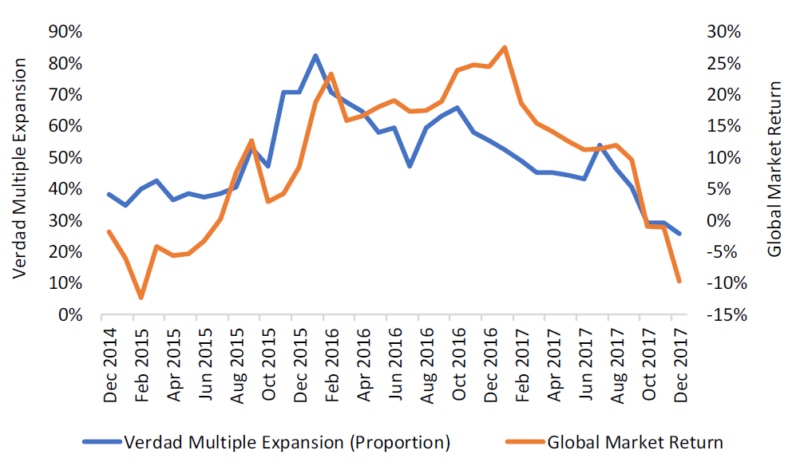
Multiple Expansion in Verdad Holdings vs. Global Market Return (Dec. 2014-Dec. 2018)
The results are hypothetical results and are NOT an indicator of future results and do NOT represent returns that any investor actually attained. Indexes are unmanaged and do not reflect management or trading fees, and one cannot invest directly in an index.
In an effort to improve the explanatory power of the deleveraging factor, they updated their model to include higher frequency data (i.e., every six months versus every year), and because models work better with data that’s closer to a normal distribution, they defined their input variables in a way that resulted in more symmetric distributions. In their December 2022 article “A Sharper Signal Amid the Noise,” Verdad showed the results of their analysis, the objective of which was to forecast deleveraging over a one-year horizon. Their outcomes were tagged with a binary indicator where “1” represented companies that reduced their long-term debt over the next year, and “0” represented all other outcomes. The updated model was trained on a randomized subsample of CRSP data from 1974 to 2014 (60 percent of unique companies), and the other 40 percent of unique companies were held out for out-of-sample testing. When testing the updated model on the hold-out sample, the algorithm estimated a probability for each company that corresponded with its likelihood of paying down debt over the next year. The results of their out-of-sample analysis on U.S. companies since 1974 are below:
Out-of-Sample Deleveraging Results in the U.S. (1974–2014)
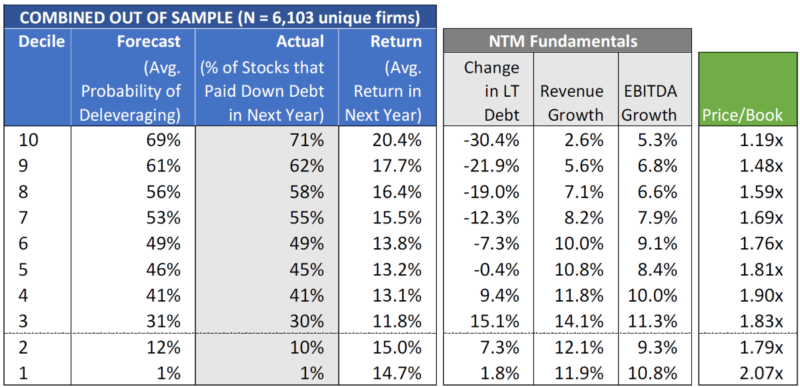
Their updated model achieved its primary objective of improving forecasting accuracy to just over 70 percent. And even though the model was not trained to forecast returns, the companies with the highest deleveraging probability also had the highest average annual returns. Note the virtually monotonic changes for each of the columns. Verdad also examined the cyclical nature of deleveraging. They found that a higher proportion of companies pay down debt when the economy is slowing down, an intuitive pattern: “When faced with the prospect of slower sales, the responsible thing for CFOs to do would be to batten down the hatches and reduce debt to weather the storm ahead.” The figure below illustrates this process among Decile 10 companies that had the highest likelihood of deleveraging according to their model. The solid line represents actual deleveraging. Note that we can see spikes in the proportion of companies that pay down debt during recessions.
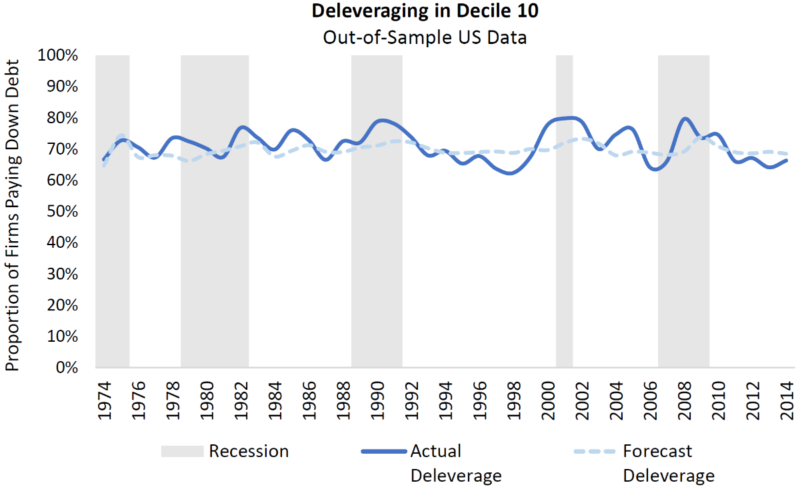
As noted earlier, persistence is an important criterion when considering an investment strategy. Note that the outcomes in the top decile remained within a consistent band between 60 and 80 percent over a 50-year sample that included a range of macro environments, from inflation spirals to stock market bubbles to financial crises. As Verdad noted: “Through all of the noise, we are pleased to see a clear majority of companies in the highest forecast decile actually paying down debt over the next year.”
Investor Takeaways
“Your Complete Guide to Factor-Based Investing” explained the importance of focusing on a long series of data that show evidence of premiums that have been persistent, pervasive, robust to various definitions, survive transaction costs and have intuitive explanations for believing the premium should persist. Given that all strategies that entail risk assets go through long periods of poor performance, it is important that investors also focus on the probabilities of outcomes—investing is always about uncertainty. The best we can do is to put the odds in our favor and diversify the risks we take. And given the amount of “noise” in the factor zoo, it is prudent to focus on a few logical and empirically robust signals.
Verdad’s research provided investors with important insight into the role deleveraging plays in explaining the cross-section of expected returns. While leverage should be expected to amplify positive returns in good times and amplify negative returns in bad times, their analysis focused on the effect of changes in leverage from one year to the next. When they looked at companies with a high propensity score according to their deleveraging model (firms that were profitable and had a track record of paying down debt in the past), they found that those firms paid down debt more frequently during economic downturns compared to economic boom periods. Therefore, the positive return effect of deleveraging should partially offset the negative amplification effect of having debt during a downturn. The net effect is still negative during downturns (and levered firms tend to be value stocks), but you are much better off holding levered companies that are paying down debt rather than levered companies that are increasing debt. During boom periods, the positive return effect of deleveraging reinforces the positive amplification of having debt during a rising market.
Summarizing, Verdad showed how investors can potentially improve performance based on their findings of the likelihood of deleveraging among leveraged stocks, and the propensity of cheaper stocks to deliver higher returns over long horizons. It will be interesting to see if other evidence-based asset managers begin to incorporate Verdad’s findings into strategies.
Larry Swedroe is head of financial and economic research for Buckingham Wealth Partners.
Disclosures
For informational purposes only and should not be construed as specific investment, accounting, legal, or tax advice. Certain information is based upon third party data and may become outdated or otherwise superseded without notice. Third party information is deemed to be reliable, but its accuracy and completeness cannot be guaranteed. Neither the Securities and Exchange Commission (SEC) nor any other federal or state agency have approved, determined the accuracy, or confirmed adequacy of this article. Indices are not available for direct investment. Their performance does not reflect the expenses associated with the management of an actual portfolio nor do indices represent results of actual trading. Information from sources deemed reliable, but its accuracy cannot be guaranteed. Performance is historical and does not guarantee future results. All investments involve risk, including loss of principal. Mentions of specific securities are for informational purposes only and should not be construed as a recommendation of specific securities. By clicking on any of the links above, you acknowledge that they are solely for your convenience, and do not necessarily imply any affiliations, sponsorships, endorsements or representations whatsoever by us regarding third-party websites. We are not responsible for the content, availability or privacy policies of these sites, and shall not be responsible or liable for any information, opinions, advice, products or services available on or through them. The opinions expressed here are their own and may not accurately reflect those of Buckingham Strategic Wealth® and its affiliates. LSR-22-419
About the Author: Larry Swedroe
—
Important Disclosures
For informational and educational purposes only and should not be construed as specific investment, accounting, legal, or tax advice. Certain information is deemed to be reliable, but its accuracy and completeness cannot be guaranteed. Third party information may become outdated or otherwise superseded without notice. Neither the Securities and Exchange Commission (SEC) nor any other federal or state agency has approved, determined the accuracy, or confirmed the adequacy of this article.
The views and opinions expressed herein are those of the author and do not necessarily reflect the views of Alpha Architect, its affiliates or its employees. Our full disclosures are available here. Definitions of common statistics used in our analysis are available here (towards the bottom).
Join thousands of other readers and subscribe to our blog.
