We can define an investment bubble as an irrational strong price increase—implying a predictable strong decline. The efficient market hypothesis (EMH) implies both the absence of bubbles and that the future return is unpredictable. In his Nobel Prize lecture, the father of the EMH, Eugene Fama stated:
“The available research provides no reliable evidence that stock market price declines are ever predictable. Thus, at least as the literature now stands, confident statements about ‘bubbles’ and what should be done about them are based on beliefs, not reliable evidence.”
Robin Greenwood, Andrei Shleifer, and Yang You authors of the study “Bubbles for Fama”, published in the January 2019 issue of the Journal of Financial Economics evaluated Fama’s claim that stock prices do not exhibit price bubbles. Based on a fixed threshold for the industry price increases (e.g., a 100 percent price run-up during two consecutive years) to filter their events and to analyze what happens afterward, they examined U.S. industry returns over the period 1926‒2014 (covering 40 episodes) and international sector returns (1985‒2014).
Following is a summary of their findings:
- Fama is correct in that a sharp price increase of an industry portfolio does not, on average, predict unusually low returns going forward.
- Sharp price increases predict a substantially heightened probability of a crash but not of a further price boom. Defining a crash as a 40 percent drawdown occurring within a two-year period, going from 50 percent industry net of market return in the previous two years to 100 percent, the probability of a crash rises from 20 percent to 53 percent. For episodes with a 150 percent industry net of market return, the probability of a crash rises to 80 percent.
- Attributes of the price run-up, including volatility, turnover, issuance, and the price path of the run-up, help forecast an eventual crash and also help forecast future returns— run-ups that end in a crash are more likely to have increases in volatility, stock issuance, acceleration, associated increases in the market P/E ratio, and disproportionate price rises among newer firms.
- Results held similarly in U.S. and international samples—price run-ups do not forecast average returns, but they are associated with a substantially elevated probability of a crash.
Their findings led them to conclude:
“The predictability of a future crash from past industry returns suggests that Fama’s conclusion should be interpreted carefully, as it implicitly draws a distinction between future returns and the likelihood of a crash.”
They further explained:
“The reasons for the difference in results between returns and crash probabilities are twofold. First, some industries just keep going up and do not crash at all. Second, bubble peaks are notoriously hard to tell, and prices often keep going up for a while before they crash, leading to good net returns for an investor who stays all the way through.”
They added:
“Even of the 21 episodes in which a crash does occur ex-post, on average prices peak six months after we first identify the industry as a potential bubble candidate. The average return between the first identification of the price run-up and the peak price is 30%, confirming the adage that it is difficult to bet against the bubble, even if one can call it correctly ex-ante.”
With that said, they also concluded that sharp price rises do provide valuable information as they, “predict a heightened likelihood of a crash.”
New Research
Dongshuai Zhao and Didier Sornette took a different approach to evaluate Fama’s claim in their December 2021 study “Bubbles for Fama from Sornette.” Instead of using fixed thresholds, they examined whether using a methodology called log-periodic power law singularity (LPPLS) would allow them to diagnose ex-ante the presence of a bubble. They explained:
“Our method is thus agnostic with respect to the mispricing level that qualifies a bubble, and more flexible to adapt to different bubble price structure, using the general criterion of a significant deviation from the standard exponential growth.”
Zhao and Sornette defined a bubble as:
“A ‘super-exponential’ price increase, which is followed by a sudden collapse. ‘Superexponential’ indicates the growth rate of the price grows itself. A constant price growth rate means the price grows exponentially, which is the standard regime of financial assets as a result of proportional growth and the law of compounding interests. When the growth rate grows itself, the price accelerates hyperbolically, which is unsustainable.”
They defined upward-accelerating price increases as a positive bubble and downward accelerating price decreases as a negative bubble.
Zhao and Sornette noted:
“The LPPLS model has been used not only in the ex-ante diagnosis and postmortem analysis of bubbles and crashes in the stock markets, but also in bond, commodity, real estate, cryptocurrency markets, and so on, which reflects the proposed universality of the super-exponential speculative bubble in different markets.”
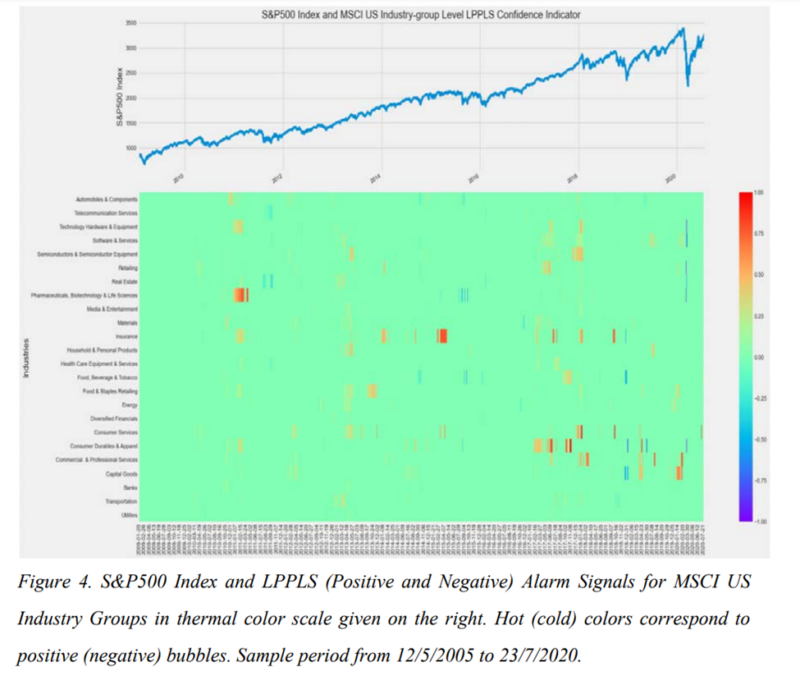
Their indicator of a bubble is the LPPLS Confidence Indicator—used to define a positive (negative) bubble event, called an “alarm” when the LPPLS Confidence Indicator meets or goes beyond a predefined threshold, or the LPPLS Confidence Indicator enters into the predefined interval groups. The LPPLS Confidence Indicator is determined at the time of analysis as the fraction of the fitting windows that satisfy pre-defined conditions.
“These conditions derive from the cumulative empirical experience obtained by the previous calibration of many financial bubbles… A large value of the LPPLS Confidence Indicator suggests that the LPPLS model is a good description of the present regime, qualifying the existence of an ongoing bubble… In contrast, a vanishing or small value of the LPPLS Confidence Indicator means that no or just a few time windows can be satisfactorily fitted into the LPPLS equation, suggesting the absence of a bubble and the presence of a more normal regime.”
Their Chinese dataset is the daily closing price of CSI SWS Industry Indexes for 28 different industries over the period February 27, 2004-July 23, 2020. Their U.S. dataset is the daily closing price of MSCI 24 US Industry Groups Indexes over the period January 20, 2009-July 23, 2020. Following is a summary of their findings:
- There were 1,131 positive and 383 negative LPPLS alarm signal events for the 28 Industry Groups in the Chinese market and 546 positive and 173 negative LPPLS alarm signal events for the 24 U.S. Industry Groups.
- Bubbles can be systematically detected ex-ante by using the LPPLS Confidence Index, in contradiction to claims that bubbles cannot be identified in real-time.
- A super-exponential price change, which is a particular kind of strong, irrational price movement, is unsustainable and therefore ends in a well-defined break of the pre-existing dynamics.
- Bubbles are quite frequent at the industry-group level in both Chinese and U.S. markets. In particular, the Chinese market has more collective bubbles (leading to predictable price decline) that develop in different industries simultaneously, even though the different industries have different business cycles. In contrast, the U.S. bubbles (leading to predictive price decline) are relatively evenly distributed in different industries over time, suggesting more decoupling.
- Positive bubbles and negative bubbles do not have symmetric shapes—a larger positive LPPLS Confidence Indicator suggests overreaction, leading to a subsequent strong price decline (bubble crash or large drawdown), while a smaller positive LPPLS Confidence Indicator implies underreaction, after which the price is found to plateau. For negative bubbles a negative LPPLS Confidence Indicator with a large amplitude quantifying an accelerated price decline only heralds higher future volatilities.
- The stronger the positive LPPLS Confidence Indicator, the larger is the confidence that there is a stronger unsustainable upward price acceleration (positive bubble) and the more likely there will be a steep price decline (bubble crash).
- The most negative LPPLS Confidence Indicator values are followed by more volatile cumulative returns after the Event Date. In contrast, the mildly negative LPPLS Confidence Indicator values are followed by more stable price plateaus.
- The upward price rebound that sometimes follows a period of large negative LPPLS Confidence Indicators is more apparent in the U.S. compared to the Chinese market.
Zhao and Sornette explained:
“A large body of research… indicates that Fama’s claim may be overlooking evidence that market inefficiency (limits of arbitrage such as costs, risks, and restrictions, etc.) and bounded rationality (cognitive limitations, information imperfection, and constraints) may actually promote the existence of transient bubbles.”
Their findings led them to conclude:
“Our empirical result strongly rejects the EMH that the current price reflects all of the information and our finding suggests that it is possible to predict the market price patterns based on the past price trajectory, at least in pockets of predictability associated with large amplitudes of the LPPLS Confidence Indicator.”
Investor Takeaways
The evidence of the ability of active managers to exploit the existence of “bubbles,” as evidenced by the annual SPIVA reports, is, at best, discouraging, as the following examples illustrate. Legendary investor Julian Robertson, who managed the Tiger Fund, actually predicted the tech bubble and refused to follow the herd because he thought the market was vastly overvalued. In 1999, the Tiger Fund was dissolved because of its underperformance. On the other side of the bubble story, was another legendary investor Stanley Druckenmiller, who managed George Soros’ Quantum Fund from 1988 through 2000. He believed the market was vastly overvalued, but also that the party was not over. He suffered a large loss in 2000 and resigned. Robertson and Druckenmiller were legendary investors, and both were right that there was a bubble present. Yet neither benefited as they could not get the timing right.
The latest example of a bubble and its bursting might be Cathy Woods’ ARK Innovation Fund (ARKK). ARKK turned in a spectacular performance in 2020, earning a 1st percentile ranking, returning 153 percent. AUM grew to about $21.5 billion, up from about just $200 million at the end of 2016. And, due to the fund’s strong performance from 2017 through 2020, the cash continued to flood in. By February 12, the fund was up about 25 percent for the year, and AUM peaked at about $28 billion that month. Unfortunately for investors, the fund lost 23.6 percent for the full year 2021, earning it a 100th percentile ranking. And investors who continued to pour money into the fund in early 2021 did much worse as the fund lost about 37 percent from its peak on February 12. AUM had fallen to about $16 billion at year-end, falling by far more than the losses alone could explain as some investors abandoned ship. Though to ARK’s credit investors were stickier than one would expect.
The takeaway is that Zhao and Sornette’s research findings might enable investors to avoid the painful losses that occur when bubbles inevitably burst, or at least improve the odds of doing so. Of course, investors would need the discipline to follow the research findings and avoid getting caught up in the herd mentality that leads to bubbles. Alternatively, investors who stay disciplined, adhering to their well-thought-out plan, can benefit from bubbles as they rebalance and reduce their holdings in the assets that have greatly appreciated. That not only locks in the gains but reduces future losses.
Important Disclosures
For informational and educational purposes only and should not be construed as specific investment, accounting, legal, or tax advice. Certain information is based upon third party data which may become outdated or otherwise superseded without notice. Third party information is deemed to be reliable, however its accuracy and completeness cannot be guaranteed. Mentions of specific securities are for illustrative purposes only and should not be construed as a recommendation of shown securities. By clicking on any of the links above, you acknowledge that they are solely for your convenience, and do not necessarily imply any affiliations, sponsorships, endorsements or representations whatsoever by us regarding third-party websites. We are not responsible for the content, availability or privacy policies of these sites, and shall not be responsible or liable for any information, opinions, advice, products or services available on or through them. The opinions expressed by featured authors are their own and may not accurately reflect those of the Buckingham Strategic Wealth® or Buckingham Strategic Partners®, collectively Buckingham Wealth Partners. Neither the Securities and Exchange Commission (SEC) nor any other federal or state agency have approved, determined the accuracy, or confirmed the accuracy of this article. LSR-22-217
About the Author: Larry Swedroe
—
Important Disclosures
For informational and educational purposes only and should not be construed as specific investment, accounting, legal, or tax advice. Certain information is deemed to be reliable, but its accuracy and completeness cannot be guaranteed. Third party information may become outdated or otherwise superseded without notice. Neither the Securities and Exchange Commission (SEC) nor any other federal or state agency has approved, determined the accuracy, or confirmed the adequacy of this article.
The views and opinions expressed herein are those of the author and do not necessarily reflect the views of Alpha Architect, its affiliates or its employees. Our full disclosures are available here. Definitions of common statistics used in our analysis are available here (towards the bottom).
Join thousands of other readers and subscribe to our blog.