Since the discovery of the size, value, and momentum effects in the 1980s and 1990s, a plethora of other factors have been identified in the asset pricing literature, which led John Cochrane to coin the phrase “zoo of factors.” It has raised questions and led to research into how many factors are needed, the replicability of originally reported results, and the decay of factor performance over time.
To improve our understanding of factor-based strategies, David Blitz, author of the May 2023 paper “The Cross-Section of Factor Returns,” explored the cross-section of factor returns using a sample of 153 equity factors. The zoo of factors is not as broad as it may seem because many constructs are highly correlated versions of the same factor (such as P/B, P/CF, P/E, P/S, and so on for the value factor). With that in mind, Blitz categorized the 153 factors into the 13 groups used by Theis Jensen, Bryan Kelly, and Lasse Pedersen in their 2022 paper, “Is There a Replication Crisis in Finance?”: value, investment, low risk, short-term reversal, seasonality, accruals, debt issuance, profit growth, profitability, quality, momentum, low leverage, and size. The focus of Blitz’s analysis was on the long-term performance of these 13 groups of factors, their risk characteristics and behavior, the cyclicality of factor returns, and the potential of factor rotation strategies.
Blitz’s sample period, July 1963-December 2021, provided coverage for 90% of the factors at the start and full coverage from 1971 onward. He examined all the factors in the Jensen, Kelly, and Pedersen Global Factor Data library, focusing on U.S. stocks because the data sample was the longest available. He obtained monthly top-minus-bottom portfolio return series constructed with the ‘capped value weighted’ methodology recommended by the authors: “Value weighting prevents an excessive weight of micro-cap stocks, similar to the Fama-French 2×3 methodology, while the capping additionally ensures that the results are not dominated by a handful of mega-cap stocks, without arbitrarily inflating the weight of small-cap stocks to 50% as with the Fama-French approach.” Here is a summary of his key findings:
Most factors exhibited a positive premium (although 11% did not pass this test, possibly due to post-publication decay or different construction methodologies).
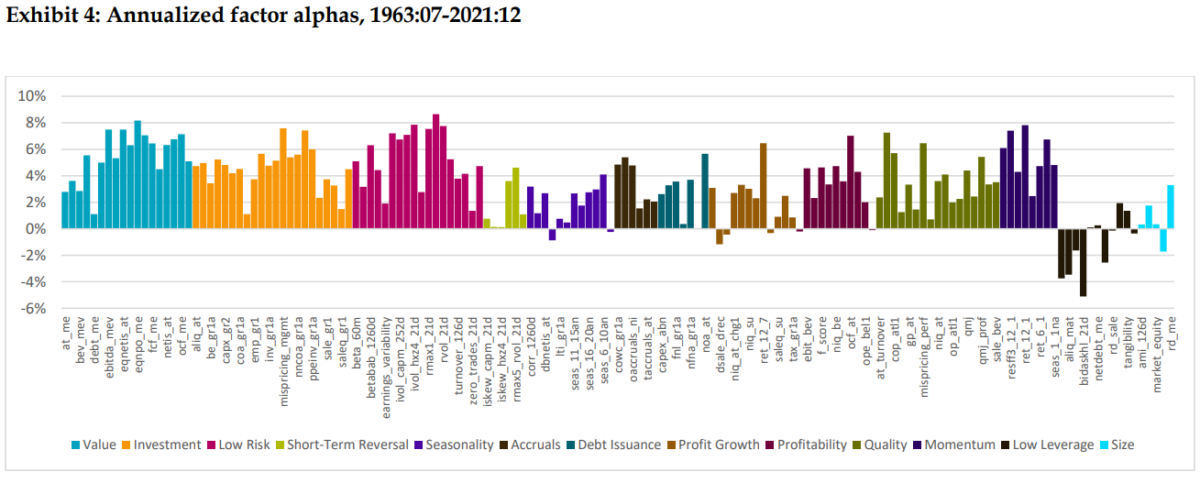
The results are hypothetical results and are NOT an indicator of future results and do NOT represent returns that any investor actually attained. Indexes are unmanaged and do not reflect management or trading fees, and one cannot invest directly in an index.
Most factors (75%) were associated with negative market betas. For the low-risk factors, this was by design and therefore most pronounced, but many factors in the value, investment, profitability, and momentum themes displayed negative betas.
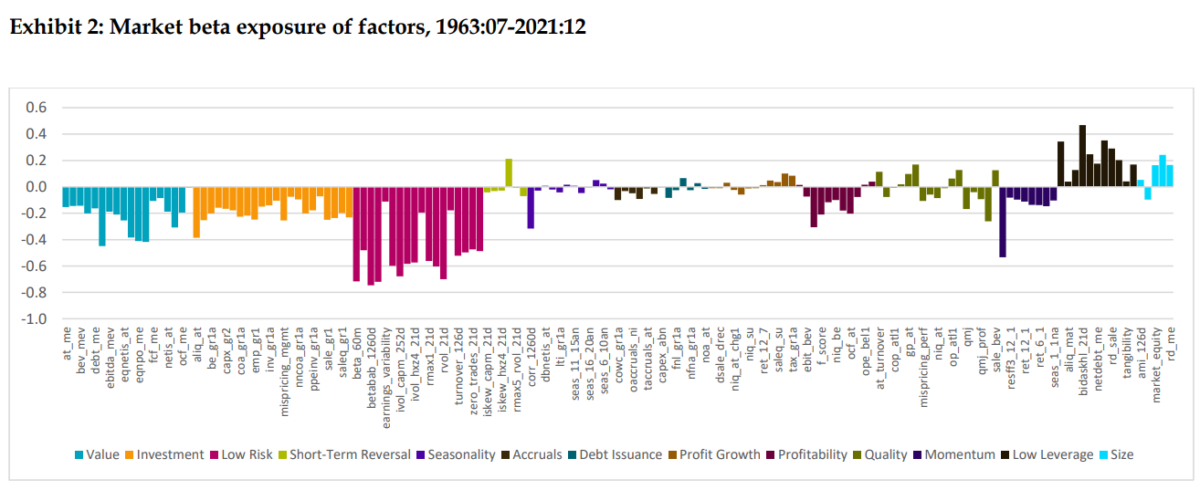
The results are hypothetical results and are NOT an indicator of future results and do NOT represent returns that any investor actually attained. Indexes are unmanaged and do not reflect management or trading fees, and one cannot invest directly in an index.
- While unrewarded factors could be found across all themes, the low-leverage theme was fragile, with a negative average return for five out of the 11 factors and an average premium of just 0.4% per annum.
- The two-factor themes with a clear positive beta, low leverage and size, had no alpha after controlling for their beta exposure.
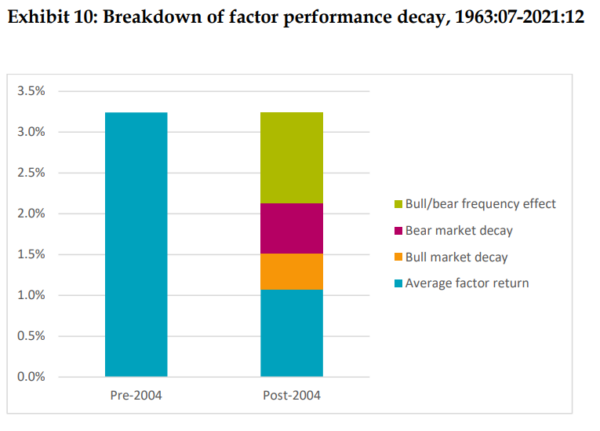
- The remaining factors generated most of their raw returns in bear markets (recall that 75% had negative market betas), explaining half of their decay in the predominantly bullish post-2004 period—the average annual return across all factors was 0.9% in bull markets versus a solid 8.6% in bear markets.
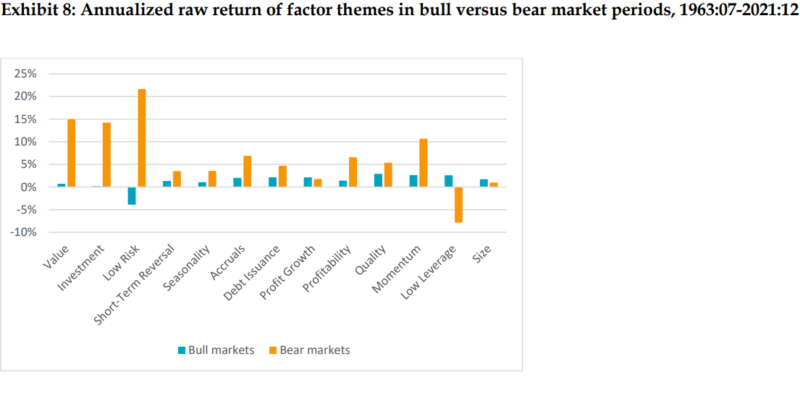
The results are hypothetical results and are NOT an indicator of future results and do NOT represent returns that any investor actually attained. Indexes are unmanaged and do not reflect management or trading fees, and one cannot invest directly in an index.
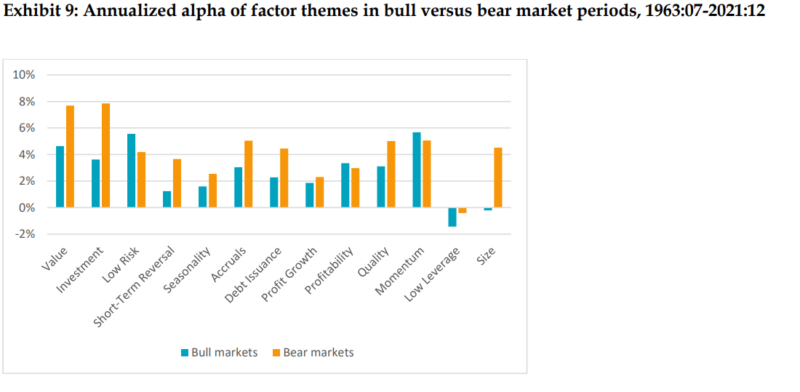
The results are hypothetical results and are NOT an indicator of future results and do NOT represent returns that any investor actually attained. Indexes are unmanaged and do not reflect management or trading fees, and one cannot invest directly in an index.
An interesting observation is that when Blitz corrected for the high beta of the size factor (the step from Exhibit 8 to 9), the multifactor alpha of the size factor turned positive in bear markets.
The results are hypothetical results and are NOT an indicator of future results and do NOT represent returns that any investor actually attained. Indexes are unmanaged and do not reflect management or trading fees, and one cannot invest directly in an index.
- Beta-adjusting factor returns yielded alphas that were not only higher but also considerably more stable.
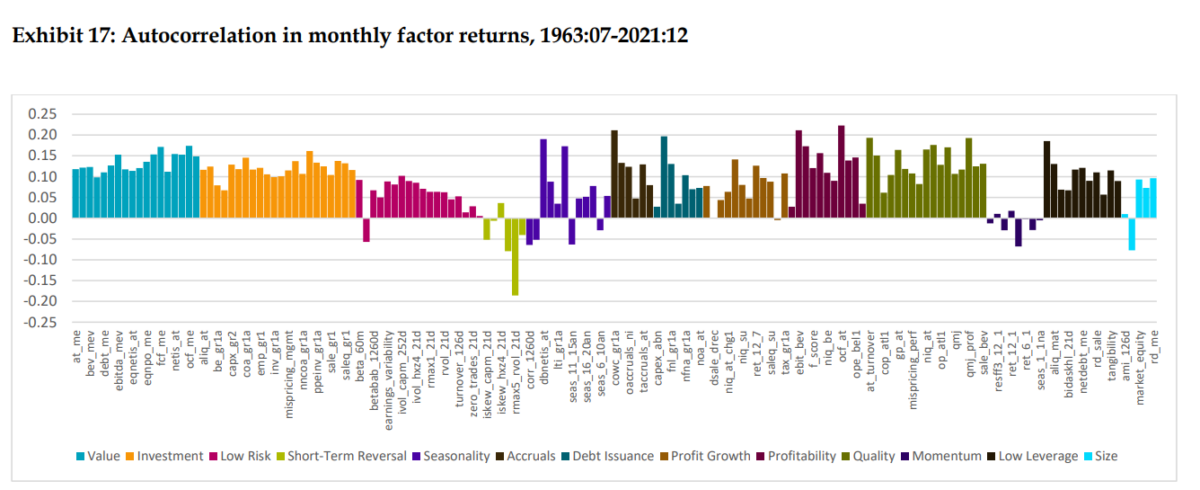
- The seasonal and momentum effects in the cross-section of factor returns were confirmed, although the seasonal effect deteriorated in the second half of the sample, calling into question its continued viability.
The results are hypothetical results and are NOT an indicator of future results and do NOT represent returns that any investor actually attained. Indexes are unmanaged and do not reflect management or trading fees, and one cannot invest directly in an index.
- Equity betas and bond betas were almost mirror images of each other—factors with low (negative) equity betas tended to have high (positive) bond betas and vice versa. Thus, factors with negative equity betas tended to benefit from falling interest rates, while factors with positive equity betas tended to benefit from rising interest rates. These findings confirmed those from Blitz’s 2020 study, “The Risk-Free Asset Implied by the Market: Medium-Term Bonds instead of Short-Term Bills.”
- It was challenging to find “all-weather factors” that did well in all phases of the cycle.
- There was a strong performance for the factor momentum strategy, with an annualized return of 10% and a Sharpe ratio of 0.58. These numbers hardly changed when excluding the momentum and short-term reversal factors, so it did not matter much if the factors without autocorrelation in their returns were dropped from the analysis. Contrary to the seasonal factor strategy, the factor momentum strategy did not show a substantial performance decay over time—factor momentum has remained a profitable strategy.
Investor Takeaways
Blitz’s findings deepen our understanding of factor behavior. Among his essential insights was: “Since bear markets comprise only 21% of the sample, this indicates that factor payoffs tend to be quite skewed. The results suggest that mispricing builds up gradually during prolonged bull markets (resulting in weak factor returns) and tends to get corrected relatively quickly in bear markets (resulting in large factor payoffs).” He added: “The market was in a bear market state 27% of the time before 2004, compared to only 9% of the time after 2004 which amounts to a factor 3 difference.” Blitz noted that adjusting for this difference, the average performance decay was only 33% instead of the 67% found by David Mclean and Jeffrey Pontiff in their 2016 study, “Does Academic Research Destroy Stock Return Predictability?” He added this observation: “Factors do well in bear markets caused by the bursting of growth bubbles, but not in bear markets caused by a crash of value stocks.”
In addition, Blitz found that it was challenging to find “all-weather” factors that did well in all market regimes. That highlights the importance of building portfolios that are diversified across factors, not concentrated in a single factor.
Another important takeaway is that Blitz showed that value stocks had negative equity betas, which suggested that they had positive bond betas and should benefit from falling interest rates. This is the opposite of the theory that because growth stocks are longer-duration stocks, they should benefit from falling rates—which was the case during the recent dark winter for value stocks (November 2016-October 2020). Complicating the matter is that in the May 2020 study “Value and Interest Rates: Are Rates to Blame for Value’s Torments?,” authors Thomas Maloney and Tobias Moskowitz found that “changes in real or nominal interest rates are often accompanied by (or are often a response to) changes in expected inflation and/or changes in expected economic growth, and hence expected cashflows are often changing as well. There may also be a change in the required risk premium which is the other (and often larger) component of the discount rate. All of these components have their own dynamics and are likely simultaneously being affected by macroeconomic conditions in possibly different ways. These confounding effects make it extremely difficult to identify what impact interest rates should have on value and growth portfolios.” As an example, they added: “Interest rate changes reflect economic conditions which almost surely are reflected in cash flows and risk premia, too, and the combined effect from these changes may dominate the duration effect.” Their findings from a U.S. data sample covering the period 1954-2019 and an international sample beginning in 1988 led them to conclude that “the performance of value is not easily assessed based on the interest rate environment, and that factor timing strategies based on interest rate-related signals are likely to perform poorly.” They added: “The interest rate regime offers little insight into value’s prospects.”
Larry Swedroe is head of financial and economic research for Buckingham Wealth Partners. For informational and educational purposes only and should not be construed as specific investment, accounting, legal, or tax advice. Certain information is based on third party data and may become outdated or otherwise superseded without notice. Third party information is deemed to be reliable, but its accuracy and completeness cannot be guaranteed. By clicking on any of the links above, you acknowledge that they are solely for your convenience, and do not necessarily imply any affiliations, sponsorships, endorsements or representations whatsoever by us regarding third-party websites. We are not responsible for the content, availability or privacy policies of these sites, and shall not be responsible or liable for any information, opinions, advice, products or services available on or through them. Neither the Securities and Exchange Commission (SEC) nor any other federal or state agency have approved, determined the accuracy, or confirmed the adequacy of this article. LSR-23-510
About the Author: Larry Swedroe
—
Important Disclosures
For informational and educational purposes only and should not be construed as specific investment, accounting, legal, or tax advice. Certain information is deemed to be reliable, but its accuracy and completeness cannot be guaranteed. Third party information may become outdated or otherwise superseded without notice. Neither the Securities and Exchange Commission (SEC) nor any other federal or state agency has approved, determined the accuracy, or confirmed the adequacy of this article.
The views and opinions expressed herein are those of the author and do not necessarily reflect the views of Alpha Architect, its affiliates or its employees. Our full disclosures are available here. Definitions of common statistics used in our analysis are available here (towards the bottom).
Join thousands of other readers and subscribe to our blog.

