Abstract: We find that by using a novel measure of investor attention, generated from InvestingChannel’s clickstream data on online financial news consumption, we can identify broad groups of stocks which are less efficiently priced and therefore where anomalies such as Value and Momentum are likely to produce greater cross-sectional differentiation in returns. We also apply these groupings to proprietary ExtractAlpha stock selection signals.
Specifically, the Value and Momentum anomalies produce long-short returns of 9.8% and 12.6% per annum before transaction costs across a broad universe of liquid U.S. equities, whereas in a high-retail-attention tercile of this universe, where our retail attention metrics have been controlled for firm size, these long-short returns nearly double in certain formulations.
This conditioning overlay on traditional and nontraditional anomalies is a relatively straightforward method for refining stock selection signals. These findings have significant implications for factor-based and quantitative investors of many types.(1)
Introduction
Stocks with heavier institutional participation will likely be more efficiently priced, and as such, anomalies such as Value and Momentum will work less well among them. Conversely, these anomalies should work better when a greater proportion of participants are relatively uninformed retail traders.
Most traditional datasets do not measure retail attention in an accurate or particularly timely way. For example, determining institutional participation using 13F filings of institutional holdings provides us with a lagged measure, as 13Fs are filed quarterly with a 45-day delay; and furthermore, these metrics are polluted with holdings by passive funds, quant funds with high turnover, and so on.
We find that a better proxy for retail participation is to measure retail trader attention directly, which we can get from clickstream data. Specifically, we use a dataset that shows, on a daily basis with a one-day delay, the number of investors who are expressing interest in a stock by visiting its ticker page on major financial websites.
About InvestingChannel and investor attention data
InvestingChannel is a leading online financial marketing and advertisement platform. Their network includes over 150 financial media publishers including many well-known media properties. The investor audience for these publishers includes about 25 million unique users, primarily retail investors. The platform allows InvestingChannel to collect clickstream traffic data on these sites.
The raw data collected from the network of publishers are at the per-audience visit level. Wherever available, each piece of content is tagged to associated tickers based on the content itself or the URLs. For this research, ExtractAlpha has processed that data to aggregate all traffic at the individual ticker level each day. The resulting data shows the number of views received by each public firm each day at the specific publisher. The data spans from 2017 to the present and covers over 9,600 public firms in the U.S. alone for 68 unique publishers.
Methodology
Investible universe
We restrict our analysis to stocks within ExtractAlpha’s investible universe of U.S. equities only, which requires stocks to have a market capitalization of at least US$100m, an average daily trading volume of at least US$1m, and a nominal stock price of at least $4, on the day in question. The resulting universe contains between 2,000 and 4,000 stocks on any given day. Our historical sample was the 2017 to 2022 period.
Constructing the attention measure
For each ticker, we first aggregate all the views it receives from publishers each day and take its log. Since the measure correlates strongly with firm size, we rank the log views within deciles of average daily trading volume (in dollars) within our investible universe. This simple construction gives us our Attention Feature 1.
We also want to consider further controlling attention feature 1 for common risk factors, so we perform a cross-sectional regression of attention feature 1 each day against the log of ADV, the Size factor, the Volatility factor, and sector dummy variables. We then take the residual term as Attention Feature 2.
For both Attention Feature 1 and Attention Feature 2, we look at 7, 28, 180, and 365-day moving averages.
Conditioning Value
We start by conditioning the Value anomaly. Here, Value is a simple equally-weighted combination of trailing earnings yield, sales yield, and book yield. To measure the performance of Value and the other anomalies, we sample daily and construct a long-short, equally-weighted portfolio where the long side is the top decile of stocks by Value and the short side is the bottom decile of stocks by Value. This portfolio has a gross return before transaction costs of 9.8% per annum. This is our benchmark Value performance.
Then, for each of Attention Feature 1 and Attention Feature 2, we break the universe into low retail attention stocks (the bottom two terciles) and high attention stocks (the top tercile) and rerun our decile portfolios within these subuniverses. The below table shows the effect of this conditioning for Features 1 and 2 calculated using various moving average lookback windows.
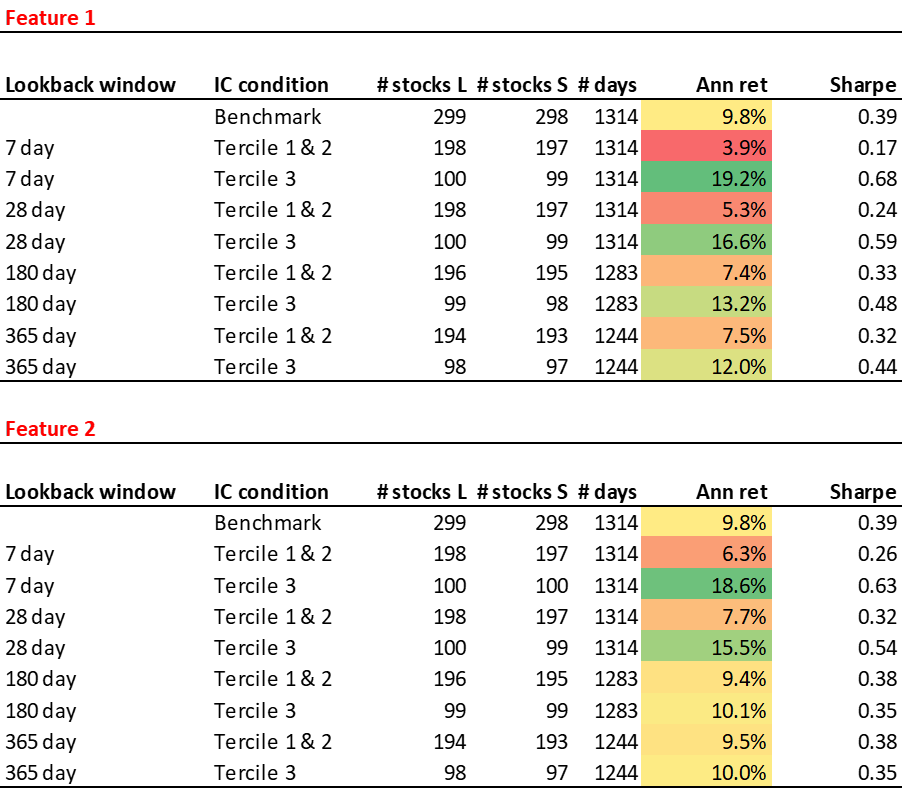
The results are hypothetical results and are NOT an indicator of future results and do NOT represent returns that any investor actually attained. Indexes are unmanaged and do not reflect management or trading fees, and one cannot invest directly in an index.
With a short 7-day lookback window and using Feature 1, we see that within the high-retail-attention cohort, the Value anomaly’s gross long-short return nearly doubles, to 19.2%, while among the low-retail-attention cohort, it drops by more than half, to 3.9% per annum. Of course, we may not want to condition a slow-moving anomaly such as Value with a fast-moving 7-day moving average, but we see that even with a more practical one-year moving average, the long-short gross return among high-Feature-1 stocks is still one-fifth greater than the benchmark, at 12.0%.
We see a similar story with Feature 2, indicating that the finding is not attributable to Liquidity, Size, Volatility, or sector biases.
Conditioning Momentum
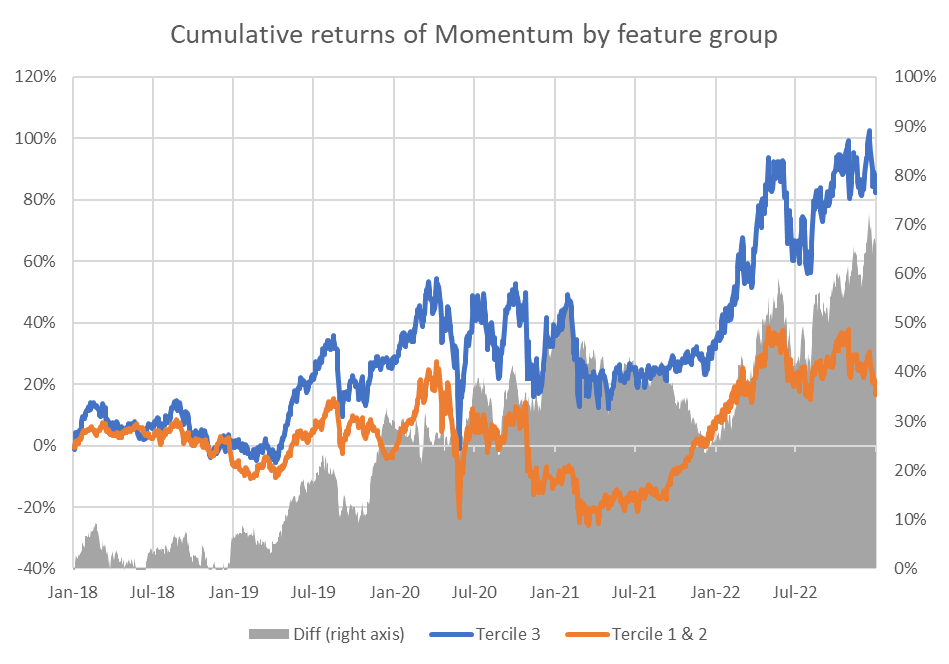
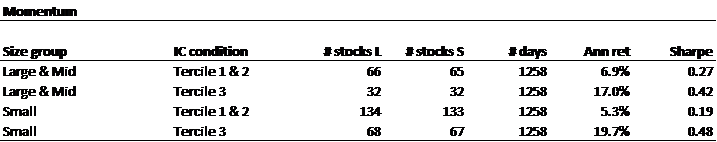
We repeat the exercise for Momentum, which is defined here as the trailing total return of the stock from 365 to 30 days ago. Here we see an even more dramatic effect, which does not diminish as we lengthen the lookback window for our retail attention metric; the benchmark Momentum long-short return is 12.6%, whereas with all variants of Feature 1, it rises to 18%, and with all variants of Feature 2 it rises to 21 to 23% for the high-retail-attention cohorts.
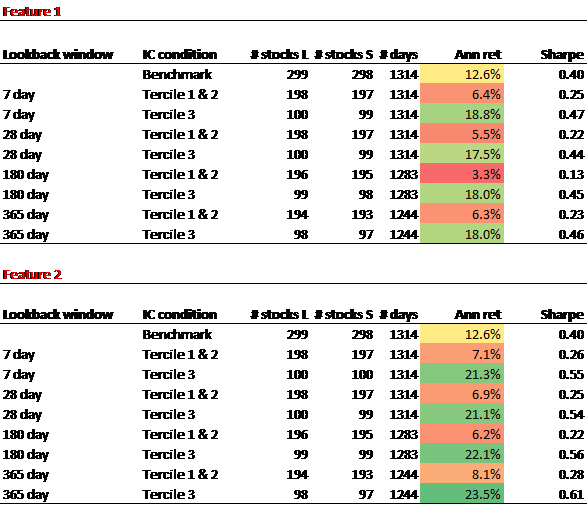
The results are hypothetical results and are NOT an indicator of future results and do NOT represent returns that any investor actually attained. Indexes are unmanaged and do not reflect management or trading fees, and one cannot invest directly in an index.
Conditioning ExtractAlpha signals
We replicate our approach with two proprietary ExtractAlpha signals:
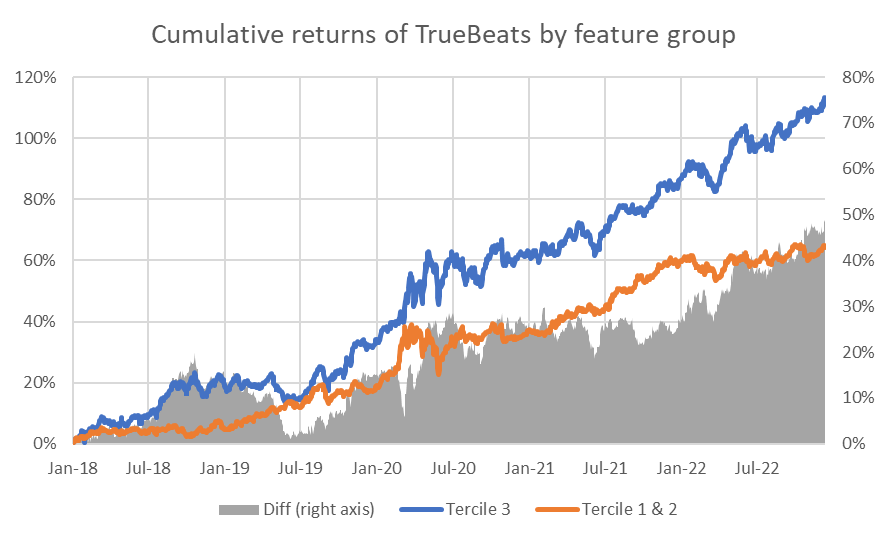
- TrueBeats: forecasts of quarterly earnings surprises based on identifying the top sell-side analysts, trends in earnings surprises, and evidence of earnings management
- Transcripts Model: natural language processing-based sentiment score applied to earnings call transcripts
Both of these signals deliver higher gross Sharpe ratios than the common factors described above, but we would like to know whether we can further refine them using our attention features.
First, we look at TrueBeats:
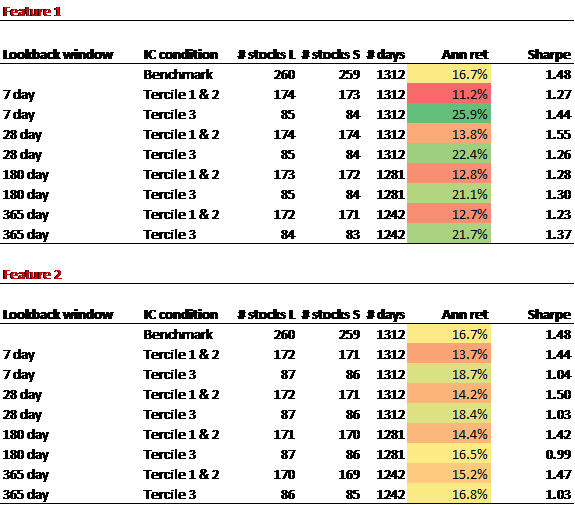
The results are hypothetical results and are NOT an indicator of future results and do NOT represent returns that any investor actually attained. Indexes are unmanaged and do not reflect management or trading fees, and one cannot invest directly in an index.
Here we see that Attention Feature 1 was similarly effective at differentiating returns as it was with Momentum, but the effect is more subdued for Feature 2, indicating that some of the results may be driven by risk exposures embedded in the conditioning feature.
Next, we look at the Transcripts Model:
The results are hypothetical results and are NOT an indicator of future results and do NOT represent returns that any investor actually attained. Indexes are unmanaged and do not reflect management or trading fees, and one cannot invest directly in an index.
Here we see directionally similar results for Feature 1, though weaker, and they are eliminated or even reversed for Feature 2.
It is possible that the more widely adopted an anomaly by institutions, the greater the value in using retail attention to condition it since the gap in efficient pricing between retail-heavy and institution-heavy names will be greater in these cases. In the case of a relatively new anomaly such as NLP-based sentiment, which is only used by a small minority of sophisticated funds, the advantage to conditioning is relatively smaller or nonexistent.
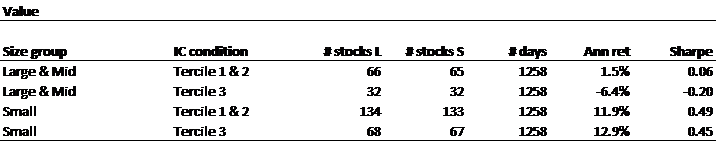
Robustness across time and by size
In this section we investigate the differential in anomaly performance by high- and low-retail attention names as a function of time, in order to see whether the differences have arisen primarily during the COVID period when retail trading increased; and by larger versus smaller names. We define large-cap as the top 500 names by market cap, mid-cap as the next 500, and small-cap as all others which meet our minimum market cap and ADV requirements. In order to increase sample sizes, we group large and mid-cap together.
For simplicity, we focus only on Attention Feature 1 with a 365-day moving average.
First, we plot the cumulative returns for each anomaly within the two groups as a function of time.
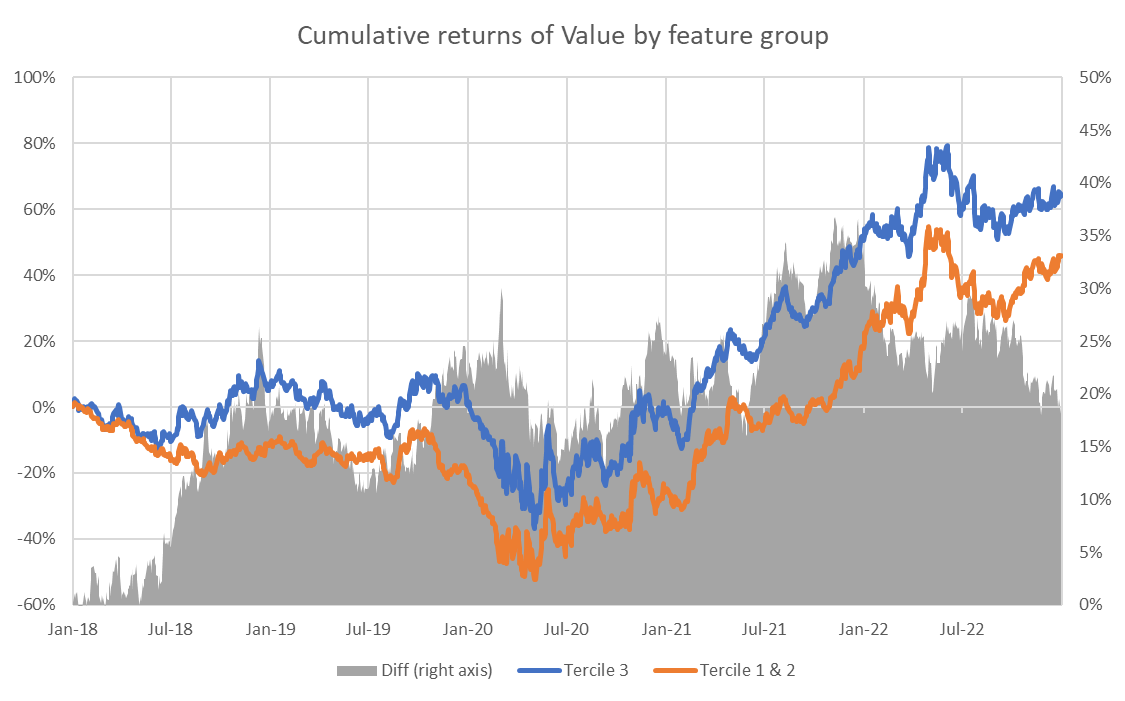
The results are hypothetical results and are NOT an indicator of future results and do NOT represent returns that any investor actually attained. Indexes are unmanaged and do not reflect management or trading fees, and one cannot invest directly in an index.
The results are hypothetical results and are NOT an indicator of future results and do NOT represent returns that any investor actually attained. Indexes are unmanaged and do not reflect management or trading fees, and one cannot invest directly in an index.
The results are hypothetical results and are NOT an indicator of future results and do NOT represent returns that any investor actually attained. Indexes are unmanaged and do not reflect management or trading fees, and one cannot invest directly in an index.
The results are hypothetical results and are NOT an indicator of future results and do NOT represent returns that any investor actually attained. Indexes are unmanaged and do not reflect management or trading fees, and one cannot invest directly in an index.
From the above charts, we can see that the difference between performance among the high- and low-retail-attention names is not isolated to the COVID period. Though it varies across the four anomalies, it adds value across most periods.
Next, we look at market capitalization.
The results are hypothetical results and are NOT an indicator of future results and do NOT represent returns that any investor actually attained. Indexes are unmanaged and do not reflect management or trading fees, and one cannot invest directly in an index.
The results are hypothetical results and are NOT an indicator of future results and do NOT represent returns that any investor actually attained. Indexes are unmanaged and do not reflect management or trading fees, and one cannot invest directly in an index.
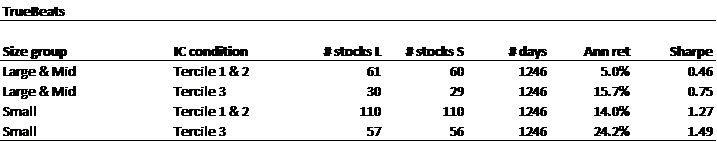
The results are hypothetical results and are NOT an indicator of future results and do NOT represent returns that any investor actually attained. Indexes are unmanaged and do not reflect management or trading fees, and one cannot invest directly in an index.
The results are hypothetical results and are NOT an indicator of future results and do NOT represent returns that any investor actually attained. Indexes are unmanaged and do not reflect management or trading fees, and one cannot invest directly in an index.
The above tables show that the distinction between high- and low-retail-attention names is relevant for most market cap slices, though more relevant for small caps. The exception is Value for large caps, where the relationship is reversed, but the Value anomaly has not been effective for large caps during this period anyway.
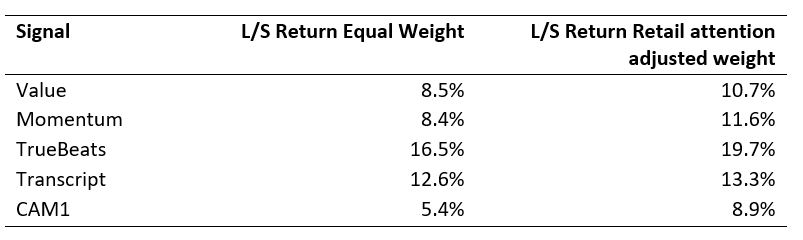
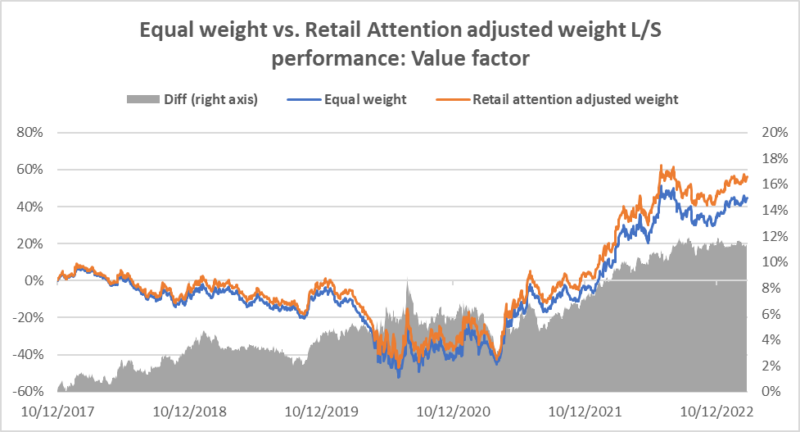
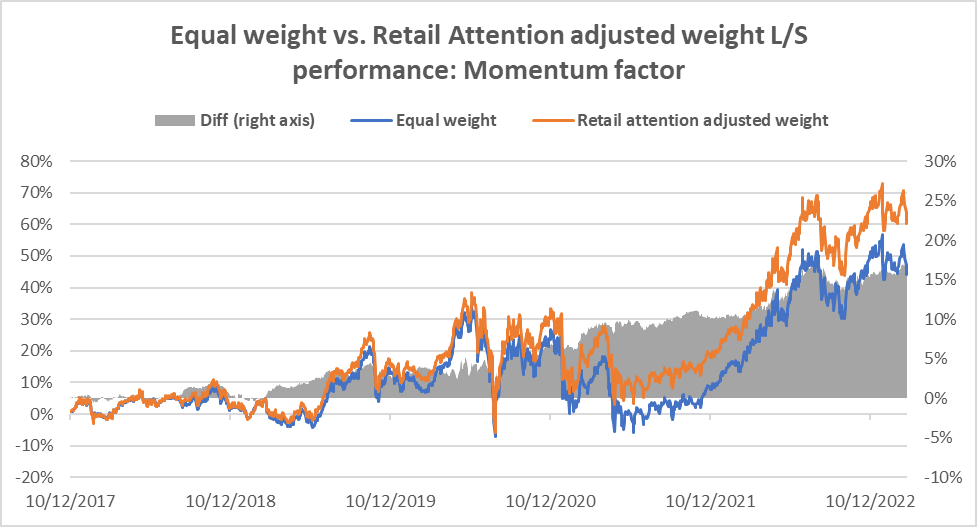
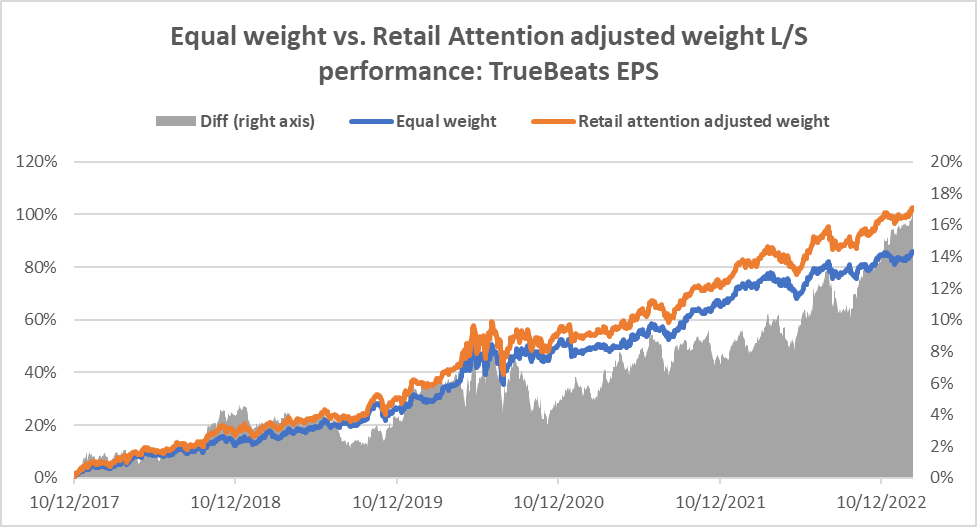
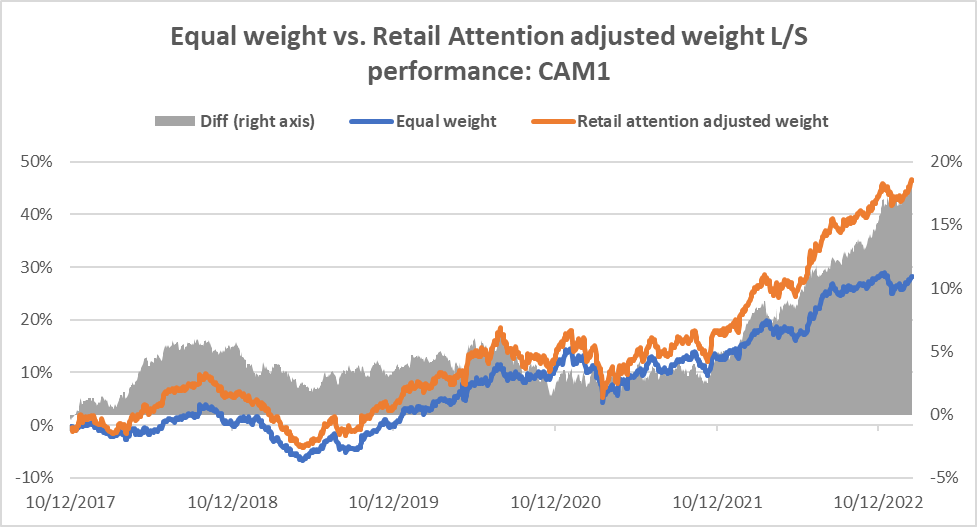
Another use case: use retail attention as an adjusting factor for long-short portfolio weights
In this section, we illustrate another use case of the retain attention data. It is based on the same hypothesis that anomalies are more prominent for stocks with high retail attention. Instead of separating the universe into high vs. low retail attention subsamples and then constructing long-short portfolios within each of them, we use the entire universe for portfolio construction and then apply retail attention to adjust the weight within the long and short buckets. This will be more in line with the common practice and the actual implementation of strategies.
For simplicity, we use the Feature 1 with a 28-day moving average. Each trading day when we construct the decile long-short portfolios using our signal, instead of equal weighting, we will use the retail attention data to adjust the weight. Specifically, we will inflate the weight by three times for stocks which have high retain attention (in the top tercile). We compare the performance of such a portfolio against the equal-weighted benchmark.
The results are hypothetical results and are NOT an indicator of future results and do NOT represent returns that any investor actually attained. Indexes are unmanaged and do not reflect management or trading fees, and one cannot invest directly in an index.
The results are hypothetical results and are NOT an indicator of future results and do NOT represent returns that any investor actually attained. Indexes are unmanaged and do not reflect management or trading fees, and one cannot invest directly in an index.
The results are hypothetical results and are NOT an indicator of future results and do NOT represent returns that any investor actually attained. Indexes are unmanaged and do not reflect management or trading fees, and one cannot invest directly in an index.
The results are hypothetical results and are NOT an indicator of future results and do NOT represent returns that any investor actually attained. Indexes are unmanaged and do not reflect management or trading fees, and one cannot invest directly in an index.
The results are hypothetical results and are NOT an indicator of future results and do NOT represent returns that any investor actually attained. Indexes are unmanaged and do not reflect management or trading fees, and one cannot invest directly in an index.
The results are hypothetical results and are NOT an indicator of future results and do NOT represent returns that any investor actually attained. Indexes are unmanaged and do not reflect management or trading fees, and one cannot invest directly in an index.
The above results show that using retail attention as a weight adjustment factor, we can achieve an additional annual alpha of 1-3% for various anomalies. We further show that the retail attention can be an effective conditioning factor for our Cross Asset Model (CAM1) signal as well.
Other approaches and conclusions
In unreported work, we also horse-raced our features with a simple metric of % institutional holdings using 13F filings and found that our features were significantly more effective. We also investigated other approaches, such as looking at spikes in retail attention, or identifying time periods where retail attention was relatively greater, but did not find these approaches to be as consistently effective.
Certainly further refinements of our conditioning approaches are possible, for example by differentiating between the different types of media outlets which are used in constructing the attention features.
Finally, this same approach could be applied to any cross-sectional alpha signal a manager may use.
We believe these findings can motivate any stock selection quant or factor investor to refine their approach to signal implementation using alternative data, even if their horizon is long, and especially if their investment approach is based on traditional investment factors or risk premia.
Vinesh Jha, CEO

Vinesh founded ExtractAlpha in 2013 in Hong Kong with the mission of bringing analytical rigor to the
analysis and marketing of new data sets for the capital markets.
From 1999 to 2005, Vinesh was the Director of Quantitative Research at StarMine in San Francisco,
where he developed industry leading metrics of sell side analyst performance as well as successful
commercial alpha signals and products based on analyst, fundamental, and other data sources.
Subsequently he developed systematic trading strategies for proprietary trading desks at Merrill Lynch
and Morgan Stanley in New York. Most recently he was Executive Director at PDT Partners, a spinoff of
Morgan Stanley’s premiere quant prop trading group, where in addition to research he also applied his
experience in the communication of complex quantitative concepts to investor relations.
Vinesh holds an undergraduate degree from the University of Chicago and a graduate degree from the
University of Cambridge, both in mathematics.
References[+]
| ↑1 |
About ExtractAlpha ExtractAlpha is an independent research firm dedicated to providing unique, curated, actionable data sets to institutional investors. ExtractAlpha applies their extensive experience in quantitative analysis and the design of investment analytics products to interesting new data sets and tools. Their rigorously built quantitative models are designed for institutional investors to gain a measurable edge over their competitors. ExtractAlpha also partners with top FinTech data firms to identify investment value in their data sets and help investors profit from these unique new sources of information. ExtractAlpha’s founding team held senior positions in the original research and sales teams at StarMine and at top quantitative hedge fund groups including Morgan Stanley PDT. |
|---|
About the Author: Vinesh Jha
—
Important Disclosures
For informational and educational purposes only and should not be construed as specific investment, accounting, legal, or tax advice. Certain information is deemed to be reliable, but its accuracy and completeness cannot be guaranteed. Third party information may become outdated or otherwise superseded without notice. Neither the Securities and Exchange Commission (SEC) nor any other federal or state agency has approved, determined the accuracy, or confirmed the adequacy of this article.
The views and opinions expressed herein are those of the author and do not necessarily reflect the views of Alpha Architect, its affiliates or its employees. Our full disclosures are available here. Definitions of common statistics used in our analysis are available here (towards the bottom).
Join thousands of other readers and subscribe to our blog.