Over the period January 2000-March 2024, the S&P 500 Index returned 7.4% per annum, outperforming the return of 2.2% per annum of Japanese large stocks (MSCI/Nomura data) by 5.2 percentage points per annum. The outperformance has been even greater since 2010, with the S&P 500 Index returning 13.7% per annum, outperforming the 6.5% per annum return of Japanese large stocks by 7.2 percentage points per annum. This persistent and massive outperformance has caused many investors to abandon their diversification strategy. The abandonment of plans could have been caused by recency bias. Or perhaps it was caused by investors believing that U.S. companies (especially the largest) have been better managed than their Japanese equivalents and have grown profits far faster during this period.
Before you jump to the latter conclusion, assuming you have not already done so, consider the following evidence from the research team at Verdad. It shows what can happen when you make assumptions without checking the empirical evidence to determine if it is consistent with those assumptions. It also demonstrates that there can be a dramatic difference in the performance of stocks and the performance of the companies themselves—which can have important implications for future stock returns.
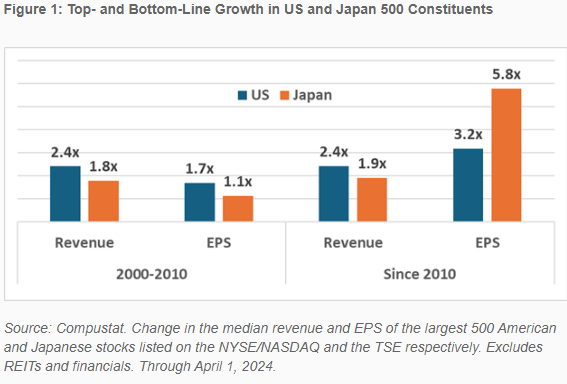
The table below shows that while large U.S. companies did outperform their Japanese counterparts from 2000 to 2010, growing earnings 1.7x versus just 1.1x, the reverse has been true since then; the 500 largest Japanese companies grew earnings per share by 5.8x since 2010, while the 500 largest U.S. companies grew earnings by 3.2x.

This dramatic outperformance in earnings growth since 2010 by the large Japanese companies is in stark contrast with both the generally held view that U.S. companies are more dynamic and better managed and in light of the dramatic outperformance of U.S. large-cap stocks.
Nick Schmitz of Verdad provided evidence of the source of the earnings outperformance by Japanese companies:
“As Japan deleveraged coming out of the nonperforming loan crisis at the turn of the century, it became one of the most well capitalized corporate markets in global equities and still enjoys some of the lowest corporate borrowing rates in the world. As a result, very little of every dollar of earnings before interest and taxes (EBIT) goes to interest payments for the typical company.”
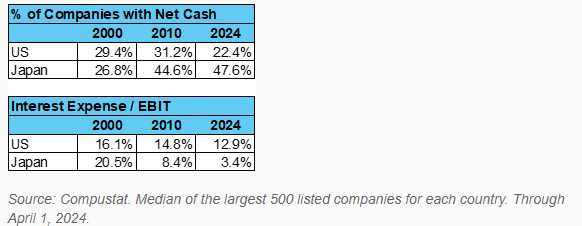
The following tables show the change in the percentage of companies that have net cash on their balance sheets as well as the amount of interest paid as a percentage of EBIT for the largest 500 companies in each country. Note that while the percentage of large U.S. companies with net cash on their balance sheets fell from 29.4% to 22.4%, the percentage of large Japanese companies with net cash rose from 26.8% to 47.6%—almost half of Japanese companies have no net debt versus less than one-quarter of U.S. companies. Another sign of financial strength is the percentage of EBIT devoted to interest expense. In the U.S. the percentage fell from 16.1% to 12.9%. Japanese companies did much better, lowering the ratio from 20.5% to just 3.4%.

The result is that today a much greater percentage of U.S. companies have net debt, and they pay a much greater percentage of their earnings to lenders. Japanese companies are more resilient to unexpected financial crises, making them relatively safer investments.
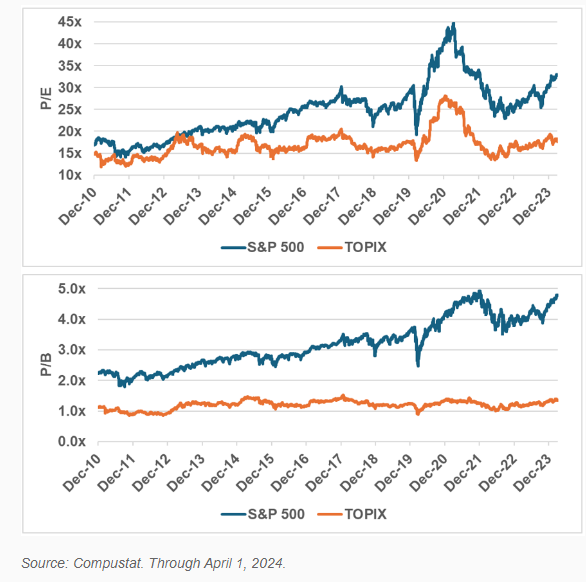
The tables below present an anomaly: Despite the fact that large Japanese companies have outperformed large U.S. companies both in earnings and in strengthening their balance sheets, the price-to-earnings (P/E) and price-to book (P/B) ratios of U.S. stocks have risen dramatically since 2010—U.S. companies became 2x as expensive on bottom-line, per-share earnings and 4x as expensive on book value, while those of large Japanese companies have been basically flat.

The results are hypothetical results and are NOT an indicator of future results and do NOT represent returns that any investor actually attained. Indexes are unmanaged and do not reflect management or trading fees, and one cannot invest directly in an index.
Investor Takeaways
The first takeaway is that while both the S&P 500 and the Nikkei indices have recently hit all-time highs, the valuation and balance sheet data we have reviewed indicate that the downside risks in Japanese stocks appear to be far less than the risks in U.S. stocks. Evidence such as this helps explain why legendary investor Warren Buffett has been buying Japanese stocks.
A second takeaway is that investors need to look “under the hood” to find the explanations for outperformance. It makes a big difference to future expected returns whether the outperformance was due to greater-than-expected earnings or from multiple expansion. The latter cannot go on forever, and there is a strong tendency to revert to the mean when the multiple expansion is not supported by underlying fundamentals. What cannot go on forever eventually ceases.
The third takeaway is that patience, discipline and avoiding recency bias (expectations of future returns are not based on recent returns but on current valuations and expected future earnings) are necessary ingredients for success, as evidenced by the quote “Markets can remain irrational longer than you can remain solvent,” which has been attributed to both John Maynard Keynes and Benjamin Graham. Whoever said it was arguing for the importance of long-term thinking in investing and against the danger of trying to time the market. In other words, even if the market seems to be behaving irrationally in the short term, it can be difficult to sustain those losses over the long term. Thus, the winning strategy is to focus on your overall investment plan and ride out the short-term ups and downs.
Larry Swedroe is the author or co-author of 18 books on investing, including his latest, Enrich Your Future: The Keys to Successful Investing
About the Author: Larry Swedroe
—
Important Disclosures
For informational and educational purposes only and should not be construed as specific investment, accounting, legal, or tax advice. Certain information is deemed to be reliable, but its accuracy and completeness cannot be guaranteed. Third party information may become outdated or otherwise superseded without notice. Neither the Securities and Exchange Commission (SEC) nor any other federal or state agency has approved, determined the accuracy, or confirmed the adequacy of this article.
The views and opinions expressed herein are those of the author and do not necessarily reflect the views of Alpha Architect, its affiliates or its employees. Our full disclosures are available here. Definitions of common statistics used in our analysis are available here (towards the bottom).
Join thousands of other readers and subscribe to our blog.
