Private debt funds are a rapidly growing segment of the private capital market. Isil Erel, Thomas Flanagan, and Michael Weisbach, authors of the April 2024 study “Risk-Adjusting the Returns to Private Debt Funds,” evaluated those risk-adjusted returns. Applying a cash-flow based method to form a replicating portfolio that mimicked their risk profiles, they reached the following conclusions:
- Using both equity and debt benchmarks to measure risk, the typical private debt fund produced insignificant abnormal returns.
- However, gross-of-fee abnormal returns were positive.
- Using only debt benchmarks led to positive abnormal returns. However, funds contain equity risks.
- The rates at which private debt funds lend appeared to be high enough to offset the funds’ fees and risks, but not high enough to exceed both their fees and investors’ risk-adjusted rates of return.
The paper attracted attention in the media, including a Bloomberg article about private credit in April 2024. Before jumping to conclusions about investing in private credit, consider the following. The paper covers the period 1992 to 2014. Private debt funds for most of the period examined were structured equity, mezzanine, and second lien funds, with very few senior secured first lien loans. During that period, many private funds also included public high-yield debt and distressed debt in their portfolios (perhaps in attempt to compensate for the high fees). Today’s private debt market is very different. As the table below shows, senior secured first lien loans comprise more than 80% of private debt funds today.

When combined with the fact that fees were much higher during the period covered by the study, it’s not surprising that they found no excess fees. In addition, it’s not surprising that they found significant equity exposures given the nature of the holdings.
Thanks to Cliffwater, which has constructed a direct lending index, we can examine the performance of private direct lending over the period 2005-2023. The Cliffwater Direct Lending Index, or CDLI, is an asset-weighted index of approximately 14,800 directly originated middle market loans totaling $315 billion as of December 31, 2023. The CDLI is used globally by institutional investors and asset managers as the index of choice for understanding the return and risk characteristics of U.S. middle market debt. Launched in 2015, the CDLI was reconstructed back to September 2004 using publicly available quarterly SEC filings required of business development companies whose primary asset holdings are U.S. middle market corporate loans. Importantly, SEC filing and transparency requirements eliminate common biases of survivorship and self-selection found in other industry universe and index benchmarks.
Using the following table from Cliffwater’s Fourth Quarter 2023 Report on U.S. Direct Lending, we can examine the returns of private direct lending firms over the period 2005-2023. The asset class with the highest calendar year return is highlighted.
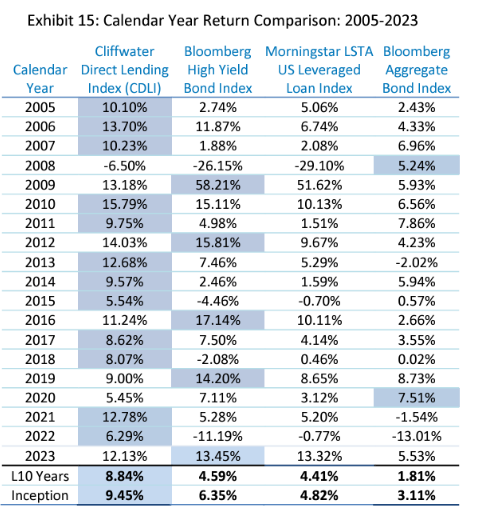
The results are hypothetical results and are NOT an indicator of future results and do NOT represent returns that any investor actually attained. Indexes are unmanaged and do not reflect management or trading fees, and one cannot invest directly in an index.
In addition to having the highest return over the last 10 years as well as the entire 19-year period, the CDLI was the highest-performing index in 13 of the 19 years.
Credit Risk
The following table shows the 19-year (2005-2023) history of credit losses for the CDLI compared to high-yield bonds, leveraged loans, and U.S. bank commercial and industrial business loans:
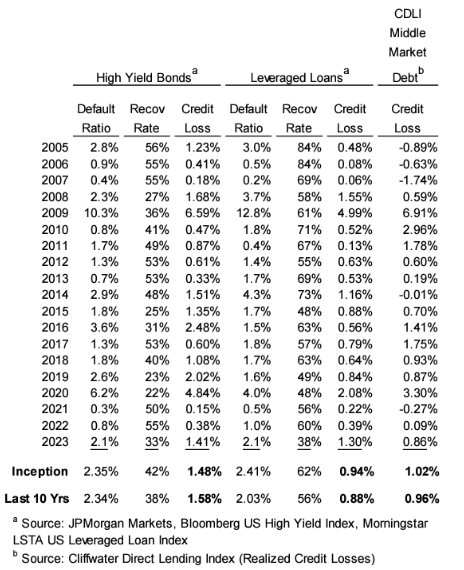
The table shows that average annual realized credit losses for middle market loans (1.02%), represented by the CDLI, were slightly higher compared to leveraged loans (0.88%) but well below credit losses for high-yield bonds (1.58%).
Cliffwater also produces an index of senior-only direct loans.
Senior-Only Direct Loans (CDLI-S)
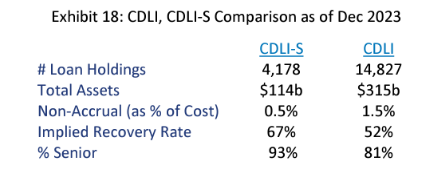
The CDLI-S is comprised of only senior loans within the CDLI. It was created in 2017 to address the comparative performance of senior middle market loans and the entire universe of middle market loans represented by CDLI. CDLI-S follows the same construction methodology as CDLI but includes only loans held by managers of business development companies that have an investment style Cliffwater has determined clearly focuses on senior secured loans. Cliffwater generates the same quarterly performance and portfolio data for CDLI-S that is available for CDLI, except that the beginning date is September 30, 2010, for CDLI-S compared to September 30, 2004, for CDLI. The shorter historical series for CDLI-S is attributable to the post-2008 introduction of most senior-only direct lending strategies. As with the CDLI, CDLI-S should not suffer from biases (backfill and survivorship) found in other databases because all source data comes from required SEC filings. As seen in the table below, loans in the CDLI-S are generally represented by larger, sponsored borrowers with a track record of lower realized losses and a lower rate of nonaccrual status.
The following tables compare the performance of the CDLI and CDLI-S from the inception of the CDLI-S in September 2010. As you would expect, while the CDLI-S provided attractive returns (8.23%) despite the much lower credit losses, its performance was below that of the CDLI (9.76%), as risk and the ex-post return were related.
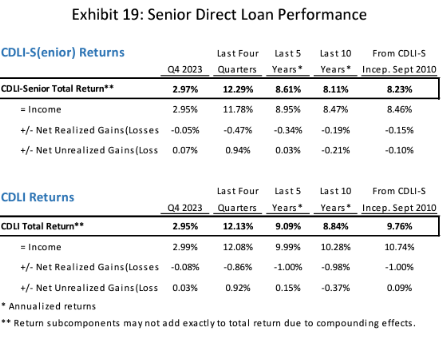
The results are hypothetical results and are NOT an indicator of future results and do NOT represent returns that any investor actually attained. Indexes are unmanaged and do not reflect management or trading fees, and one cannot invest directly in an index.
Fees
In its 2023 fee survey for investment management services for middle market corporate lending covering 58 of the largest direct lending firms (managing $924 billion in direct lending assets), Cliffwater found that management fees and administrative expenses for direct lending private funds averaged 3.94%. The 3.94% was composed of 1.96% in management fees, 1.50% in carried interest (performance fee), and 0.48% in administrative expenses. However, note that Cliffwater’s fund (CCLFX)1, which invests mainly in senior secured loans that are sponsored by leading private equity firms, has management fees and other expenses (excluding interest on borrowed funds) of a much lower 1.63%, and there is no incentive fee. In addition, CCLFX’s fee is charged only on net, not gross, assets.
Having examined the raw returns, we turn now to examining risk-adjusted returns.
Risk-Adjusted Returns
To address the concern about risk-adjusted returns, Cliffwater used a multi-asset regression approach first suggested by Nobel Laureate Bill Sharpe. They applied this methodology, often called “style analysis,” to the CDLI, a transparent, quarterly index of private middle market loans with returns (gross of fees) covering the period September 30, 2004, to December 31, 2024. The quarterly CDLI returns, the dependent variable, were regressed against two independent variables: the Russell 3000 Index, representing equity risk, and the Morningstar LSTA US Leveraged Loan Index, representing credit risk.
They found that private debt, represented by the CDLI, earned 6.19% and 5.85% annual excess returns, risk-adjusted and gross of fees, over the entire 19.25-year study period and trailing 10 years, respectively. The Sharpe-based regression results assigned public equity and credit exposures of 6% and 23%, respectively, over the 19.25-year period, and 0% and 44% over the trailing 10-year period. All exposures were statistically significant except for the 10-year equity value equal to 0%. These findings are very different from those of the Erel, Flanagan, and Weisbach study, both in the size of the excess return assigned to private debt and its exposure to equity risk. Given that fees for unlevered private debt typically average no more than 2%, risk-adjusted excess return equaled approximately 4%, not zero.
Investor Takeaway
Investors who seek higher yields and relatively low risk, and who are willing to sacrifice liquidity, will find attractive opportunities in interval funds that invest in senior secured, sponsored middle market loans.
Larry Swedroe is the author or co-author of 18 books on investing, including his latest Enrich Your Future.

About the Author: Larry Swedroe
—
Important Disclosures
For informational and educational purposes only and should not be construed as specific investment, accounting, legal, or tax advice. Certain information is deemed to be reliable, but its accuracy and completeness cannot be guaranteed. Third party information may become outdated or otherwise superseded without notice. Neither the Securities and Exchange Commission (SEC) nor any other federal or state agency has approved, determined the accuracy, or confirmed the adequacy of this article.
The views and opinions expressed herein are those of the author and do not necessarily reflect the views of Alpha Architect, its affiliates or its employees. Our full disclosures are available here. Definitions of common statistics used in our analysis are available here (towards the bottom).
Join thousands of other readers and subscribe to our blog.