Since the turn of the century portfolios have been exposed to four periods of crisis: the bursting of the tech bubble and the events of September 11, 2001, from 2000-2002; the Great Financial Crisis in 2007-2008, the COVID-19 pandemic in 2020, and the period of persistent inflation in 2022 when both stocks and bonds experienced double-digit losses. These experiences increased investor interest in tail risk hedging strategies. The empirical research evidence demonstrates that time-series momentum (TSMOM)— the trend of an asset with respect to its own past performance—is a logical candidate for consideration.
In Appendix F of our book “Your Complete Guide to Factor-Based Investing” Andrew Berkin and I presented the evidence that TSMOM, also known as trend following, was one of a small set of factors that met all the criteria we established for consideration of including an allocation. The criteria are that it must provide explanatory power to portfolio returns and have delivered a premium (higher return than the one-month Treasury bill). Additionally, the factor must be:
- Persistent — It holds across long periods of time and different economic regimes.
- Pervasive — It holds across countries, regions, sectors, and even asset classes.
- Robust — It holds for various definitions (for example, there is a value premium whether measured by price-to-book, earnings, cash flow, or sales, or a momentum premium whether measured by a short-term trend, an intermediate-term trend, or a longer-term trend).
- Investable — It holds up not just on paper, but also after considering actual implementation issues, such as trading costs.
- Intuitive — there are logical risk-based or behavioral-based explanations for its premium and why it should continue to exist.
The Evidence
Ian D’Souza, Voraphat Srichanachaichok, George Jiaguo Wang, and Chelsea Yaqiong Yao, authors of the 2016 study “The Enduring Effect of Time-Series Momentum on Stock Returns over Nearly 100-Years,” covering the 88-year period from 1927 to 2014, found that it met all of the criteria, including providing positive risk-adjusted returns in all 13 equity markets studied, and across various formation and holding periods. For example, a value-weighted strategy of going long stocks with positive returns in the prior 12 months (skipping the most recent month) and going short stocks with negative returns during the same time produced an average monthly return of 0.55 percent that was highly significant (t-stat = 5.28). It was also present following both up and down markets, producing an average monthly return of 0.57 percent (t-stat = 2.09) following down markets and 0.54 percent (t-stat = 5.30) following up markets.
The 2017 study “A Century of Evidence on Trend-Following Investing” by Brian Hurst, Yao Hua Ooi, and Lasse H. Pedersen constructed an equal-weighted combination of one-month, three-month, and 12-month time-series momentum strategies for 67 markets across four major asset classes (29 commodities, 11 equity indices, 15 bond markets, and 12 currency pairs) from 1880 to 2016 and found that annualized net (after costs) returns were 11.2% over the full period—higher than the return for equities but with about half the volatility (an annual standard deviation of 9.7%. They also found that the performance was remarkably consistent over an extensive time horizon that included the Great Depression, multiple recessions and expansions, multiple wars, stagflation, the global financial crisis of 2008, and periods of rising and falling interest rates. And, perhaps most importantly for risk averse investors they found that trend-following performed particularly well in extreme up or down years for the stock market, including the global financial crisis of 2008—during the 10 largest drawdowns experienced by the traditional 60/40 portfolio over the past 135 years, the time-series momentum strategy experienced positive returns in eight of the stress periods and delivered significant positive returns during a number of these events.
Implementing Trend Following
As discussed, one of the criteria Andrew Berkin and I established for considering an allocation to a strategy is that it must be robust to various definitions. D’Souza, Srichanachaichok, Wang, and Yao found that time-series stock momentum was profitable regardless of formation and holding periods for 16 different combinations. While the robustness to various definitions provides confidence that the evidence is not a result of data mining (and thus a random outcome that cannot be relied on to persist) it does have implications for implementation because there are many different time formation and holding periods that can be used to construct a trend following strategy.
Martin Florea, Stefan Florea, Iliya Kutsarov, Thomas Maier, and Marcus Storr, authors of the study “CTAs: Superior Performance or Diversification Only?,” published in the Spring 2018 issue of The Journal of Wealth Management, examined the performance of 1,558 CTAs from 1971 to 2016, adjusted to remove common problems such as backfilling and survivor bias. While they did find that a portfolio of equities, bonds, and commodities (in the ratio 55/35/10) delivered superior risk-adjusted returns when CTAs were added, up to and beyond a prescribed maximum allocation of 20%—benefiting from CTAs exhibiting very low correlations with stocks (0.03) bonds (0.08) and commodities (0.07)—they also found that CTAs exhibited relatively low correlations with each other. The median pairwise correlation coefficient was 0.08 and there were negative correlations among 36.6% of CTAs., according to the CFA Institute Journal Review. That points to the need to diversify across various CTAs or trend following strategies.
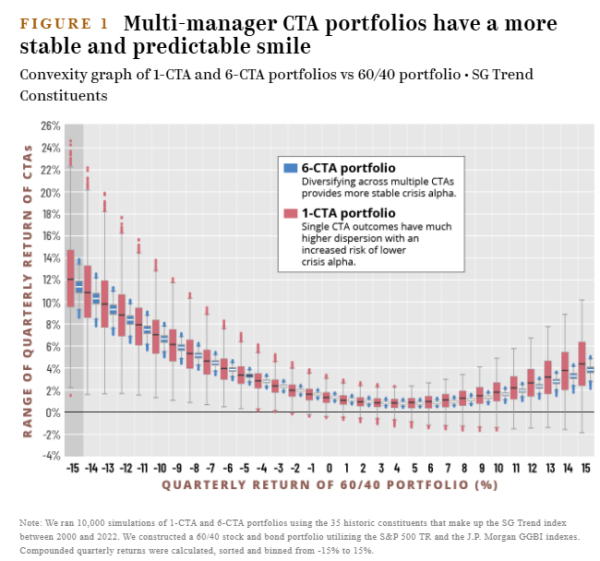
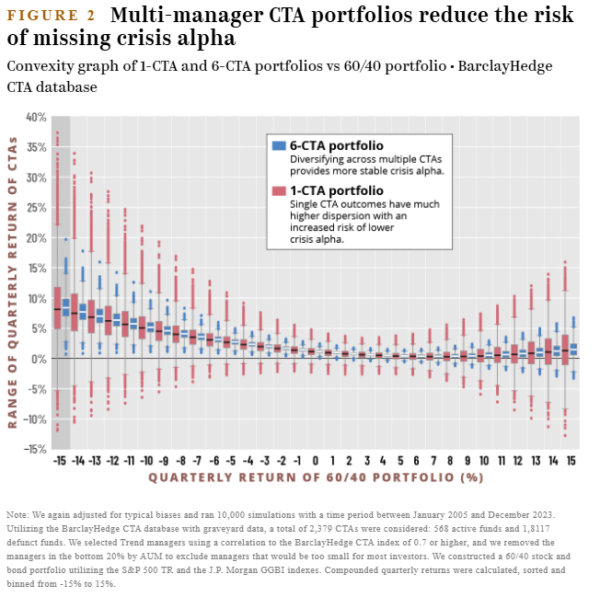
Joel Handy and Marat Molyboga of Efficient Capital Management demonstrated the importance of diversification in their study of all 35 trend managers included in the SG Trend index between January 2000 and December 2023. They conducted 10,000 simulations for both 1-CTA portfolios (portfolios with one CTA manager) and 6-CTA portfolios (with six managers). They repeated their analysis using the BarclayHedge CTA database, the largest publicly available database of CTA returns, after accounting for all typical biases. Again they used 10,000 simulations with a time period between January 2005 and December 2023. Trend managers were selected using correlation to the BarclayHedge CTA index of 0.7 or higher, and they removed the managers in the bottom 20% by AUM to exclude managers that would be too small for most investors.
The figure below compares the convexity of CTA returns (the “CTA smile”) based on the SG Trend index to those of a 60/40 portfolio. As one example, the distribution shows that if the 60/40 portfolio is down 15%, a 6-CTA portfolio has a distribution between 8-13%, whereas a 1-CTA portfolio performance could range between 2% and 25%.

The results are hypothetical results and are NOT an indicator of future results and do NOT represent returns that any investor actually attained. Indexes are unmanaged and do not reflect management or trading fees, and one cannot invest directly in an index.
The next table shows the benefits of using a multiple manager strategy in reducing tail risks.

The results are hypothetical results and are NOT an indicator of future results and do NOT represent returns that any investor actually attained. Indexes are unmanaged and do not reflect management or trading fees, and one cannot invest directly in an index.
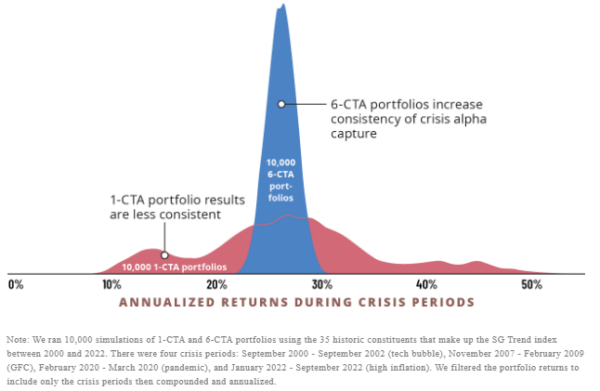
The next table shows the distribution of annualized returns of 1-CTA vs 6-CTA portfolios across the four crisis periods (2000-02, 2007-08, 2020, 2022)—once again demonstrating the prudence of diversification across CTA strategies and managers. The 6-CTA portfolio captured what the authors called “crisis alpha” in a more stable and predictable manner delivering annualized returns between 20% and 30%, while the performance of the 1- CTA portfolios was more unpredictable with the annualized returns ranging between 10% and 50%.

The results are hypothetical results and are NOT an indicator of future results and do NOT represent returns that any investor actually attained. Indexes are unmanaged and do not reflect management or trading fees, and one cannot invest directly in an index.
There is one other implementation issue we need to discuss—the need to avoid the all-too-human biases that negatively impact the performance of so many investors. The biases include recency bias, relativity bias (comparing the returns of one strategy to another that outperformed) and its “kissing cousin,” tracking variance regret (when a strategy underperforms a major market index such as the S&P 500. These biases lead to the abandonment of even well-thought-out plans when a strategy performs poorly, or even relatively poorly, for an extended period.
Discipline Required
There is one aspect of the behavior of trend following that investors should be aware of. Mark Hutchinson and John O’Brien, authors of the 2014 study “Is This Time Different? Trend Following and Financial Crises,” covering almost 100 years, found that while trend following has tended to perform well in crises, it tends to perform poorly for extended periods post-crises. Thus, investors must be highly disciplined, willing to endure long periods of underperformance, to benefit from the tail hedging properties of trend following.
As mentioned earlier, one of the criteria for investment is a risk- or behavioral-based explanation for why you should believe the premium will persist.
Intuitive Explanation for Performance
A large body of research has attempted to provide explanations for the performance of trend following. The most likely candidates to explain why markets have tended to trend include: investors’ behavioral biases; market frictions; hedging demands; and market interventions by central banks and governments. Since such market interventions and hedging programs still exist, and investor behavior tends not to change—it seems that they are likely to continue to suffer from the same behavioral biases.
Investor Takeaways
The first takeaway is that if you are going to include an allocation to trend following, given the observation of a strong dispersion of annualized returns among CTAs, you should consider diversifying across multiple CTAs (or trend following strategies).
The second takeaway is that an investor in trend following must be prepared to experience long periods of poor performance (typical after crises). Of course, this is also true of every single risk strategy—otherwise there would be no risk and no risk premium. If you doubt that, consider that there have been three periods of at least 13 years—the 15 years from 1929 to 1943, the 17 years from 1966 to 1982, and the 13 years from 2000 to 2012—when the S&P 500 underperformed riskless one-month Treasury bills. Thus, discipline will be required to avoid abandoning the strategy—if you are subject to recency bias, relativity bias, or tracking variance regret don’t even think about an allocation to trend following.
A third takeaway is that while trend following has in most cases provided left tail hedging benefits, there are other assets you can consider that are uncorrelated (such as reinsurance and long-short, market neutral funds) or have low correlation (such as private credit that is senior, secured, and sponsored by private equity). These assets have limited, or no, exposure to the economic cycle risk of stocks and/or the duration/inflation risk of bonds. Thus, investors deciding to include and allocation to trend following can further improve the efficiency of their portfolio by also adding allocations to the other uncorrelated strategies, further reducing tail risks by reducing the dispersion of potential outcomes.
Larry Swedroe is the author or co-author of 18 books on investing, including his latest Enrich Your Future.
About the Author: Larry Swedroe
—
Important Disclosures
For informational and educational purposes only and should not be construed as specific investment, accounting, legal, or tax advice. Certain information is deemed to be reliable, but its accuracy and completeness cannot be guaranteed. Third party information may become outdated or otherwise superseded without notice. Neither the Securities and Exchange Commission (SEC) nor any other federal or state agency has approved, determined the accuracy, or confirmed the adequacy of this article.
The views and opinions expressed herein are those of the author and do not necessarily reflect the views of Alpha Architect, its affiliates or its employees. Our full disclosures are available here. Definitions of common statistics used in our analysis are available here (towards the bottom).
Join thousands of other readers and subscribe to our blog.

