Investing formulas are simple, easy-to-implement, systematic, stock screeners that provide instructions on how to outperform the total stock market. Marcel Schwartz and Matthias Hanauer, authors of the December 2024 study, “Formula Investing,” evaluated the effectiveness of four such popular investing formulas over the period 1963-2022:
- The Piotroski F-Score: The sum of nine binary (+ or 0) signals measuring the financial strength of a firm in order to distinguish financially weak from financially strong firms among value stocks.
- The Magic Formula: Ranks companies by return on capital (ROC) and earnings yield, investing in companies with the highest combined score.
- The Acquirer’s Multiple: A valuation ratio, calculated as enterprise value divided by operating earnings.
- The Conservative Formula—An investment formula that selects 100 stocks based on three criteria: low return volatility, high net payout yield, and strong price momentum.
Their analysis was based on the comprehensive CRSP/Compustat universe, but excluded microcaps to dismiss concerns that tiny stocks, often illiquid and hard to trade, drive the results. Their sample consisted of companies with a minimum market capitalization of $450 million and an average of almost $31 billion as of December 2022. The average number of stocks was 921, ranging from a low of 298 firms in July 1963 to a high of 1,163 in April 2002.
Schwartz and Hanauer sorted stocks into decile portfolios and computed their raw and risk-adjusted performance. Portfolios were updated at the end of each quarter, using the latest price and stock data at formation and yearly accounting data with a reporting lag of at least six months. They also regressed the top-minus-bottom return spreads on common asset pricing factors to determine how much of the formulas’ performance was attributable to their exposure to these factors. Finally, they adopted a “do-it–yourself” (DIY) investor’s perspective by forming concentrated long-only portfolios of the 40 best-ranked stocks for each formula and evaluating their performance in the post-2000 period.
Following is a summary of their key findings:
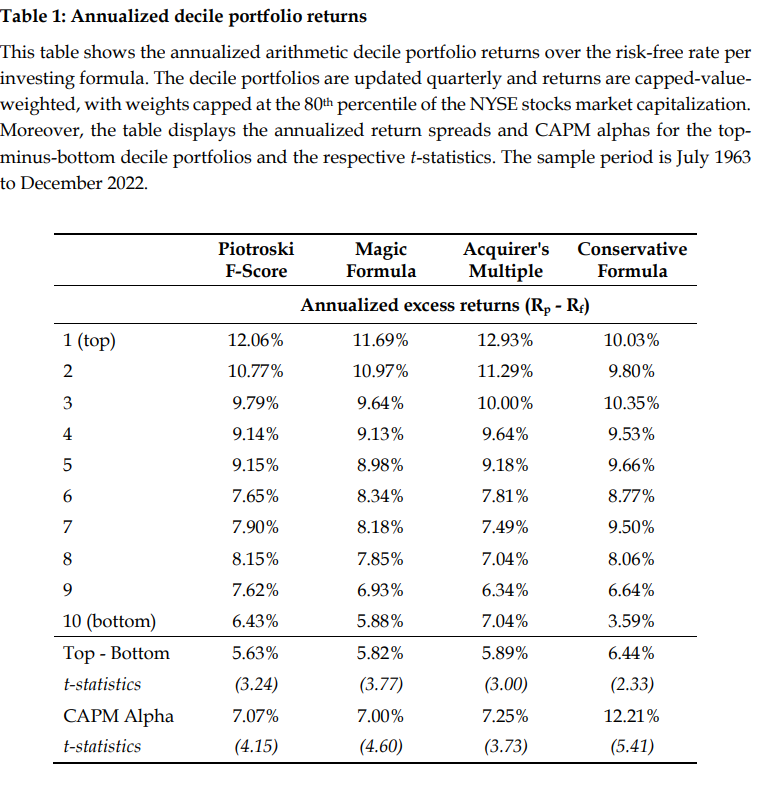
All formulas produced near-monotonically increasing returns when sorting stocks into decile portfolios.

The results are hypothetical results and are NOT an indicator of future results and do NOT represent returns that any investor actually attained. Indexes are unmanaged and do not reflect management or trading fees, and one cannot invest directly in an index.
- Each formula generated significant raw and risk-adjusted returns, primarily by providing efficient exposure to well-established style factors.
- The top-minus-bottom portfolios exhibited significant annual raw returns ranging from 5.6% to 6.4%, while the CAPM alphas ranged from 7.0% to 12.2%.
- No single formula consistently outperformed across all metrics.
- The Acquirer’s Multiple achieved the highest returns for top decile portfolios.
- The Conservative Formula lead in CAPM alpha and return spread.
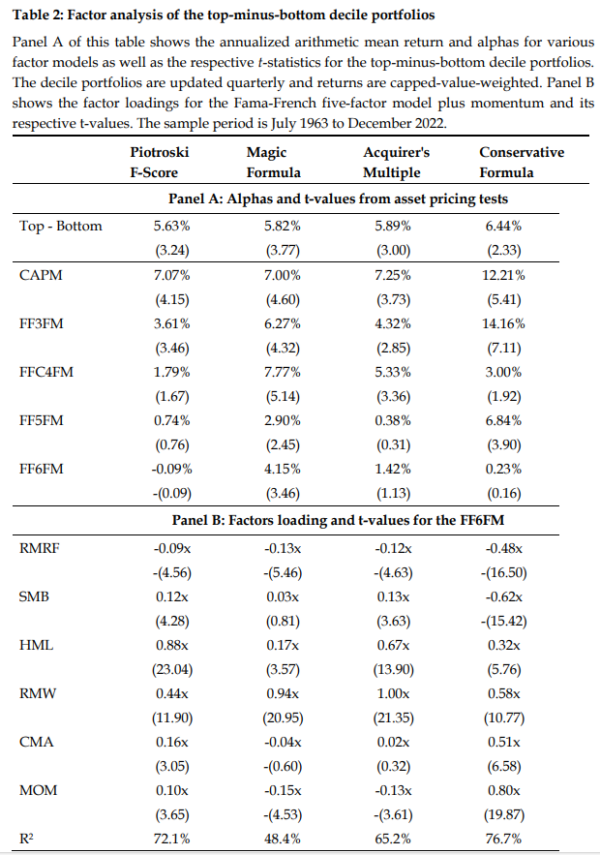
- The Magic Formula exhibited the highest remaining alpha after adjusting for common factors.
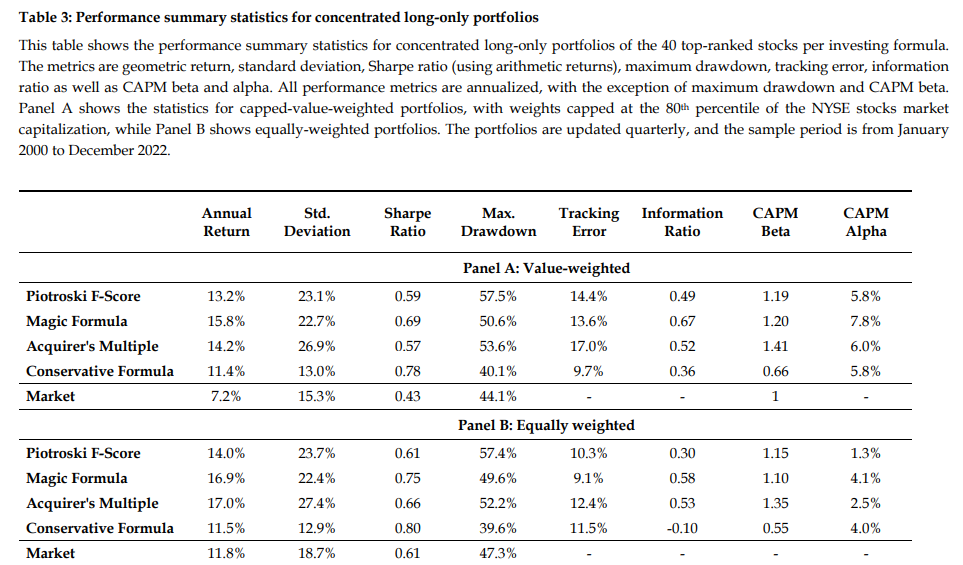
- For concentrated capped-value-weighted portfolios of 40 stocks in the post-2000 period, the Magic and Conservative Formulas produced the highest raw and risk-adjusted performance, respectively.
- Against the five-factor model plus momentum, all formulas produced negative exposure to the market factor—the top portfolio, compared to the bottom portfolio was relatively more tilted to defensive low-beta stocks, whereas the bottom portfolio was relatively more tilted to cyclical high-beta stocks. The Conservative Formula was the most defensive, with a market beta of -0.48, whereas the other formulas had betas around -0.10.
- The F-score and Acquirer’s multiple had positive size tilts (SMB)—the performance tended to be better during times when small caps outperformed. The Magic Formula was neutral, while the Conservative Formula had a significant negative SMB exposure.
- All formulas exhibited positive exposure to value (HML), with the Acquirer’s Multiple and the F-Score having the highest loadings.
- All formulas were positively correlated to the profitability (RMW) factor. The Magic Formula and the Acquirer’s Multiple exhibited the highest exposure.
- The Magic Formula and the Acquirer’s Multiple had nearly no weight on the investment factor (CMA), but the F-Score and especially the Conservative Formula did.
- Except for the Conservative Formula, which has momentum built into its formula, and a small momentum beta for the F-Score, the other formulas had negative exposure to the momentum factor—companies with a low market capitalization in relation to their operating earnings or book equity often exhibit negative momentum.

- All top decile portfolios underperformed the market during the run-up of the “dot-com bubble” between 1998 and 2000 and during the “Quant Winter” between 2018 and 2020.
- While all formulas remained successful for concentrated long-only portfolios in the post-2000 period, there was some performance decay relative to earlier periods, underscoring the need for continuous innovation in investing strategies.

The results are hypothetical results and are NOT an indicator of future results and do NOT represent returns that any investor actually attained. Indexes are unmanaged and do not reflect management or trading fees, and one cannot invest directly in an index.
Their findings led Schwartz and Hanauer to conclude:
“The investigated investment formulas are relatively easy to implement, which distinguishes them from more complex and sophisticated models, such as machine-learning prediction models, which have become popular in recent years. Although these more complex models typically provide higher gross returns, they also entail higher turnover and transaction costs. Moreover, investors may encounter additional investment barriers, including limited access to the necessary data, missing infrastructure to process the data, or the inability to execute the resulting signals in a timely and efficient manner. These more sophisticated models present therefore only genuine opportunities for those investors who are able to overcome these challenges. In contrast, the investigated investing formulas provide investors with efficient exposure to established factor premiums and are relatively easy to implement.”
Investor Takeaways
Schwartz and Hanauer demonstrated that simple, easy-to-implement, systematic formula-based investing can still generate market outperformance, providing investors with efficient exposure to well-documented factor premiums. Note that the concentrated DIY formulas, with just 40 holdings, will have greater exposure to the common factors because of their limited size. They also then take on more idiosyncratic risks that a mutual fund or ETF can minimize. In addition, the DIY formulas avoid the expense ratios of fund managers. As a caution, the fact that all four strategies underperformed from 1998-2000 and again from 2018-2020 demonstrates that successful investing requires investor discipline. And finally, the fact that the effectiveness of these formulas has weakened in recent years demonstrates that markets are becoming more efficient over time (Andrew Lo’s Adaptive Markets Hypothesis), indicating the importance of continuous innovation in investing strategies.
Larry Swedroe is the author or co-author of 18 books on investing, including his latest Enrich Your Future.
About the Author: Larry Swedroe
—
Important Disclosures
For informational and educational purposes only and should not be construed as specific investment, accounting, legal, or tax advice. Certain information is deemed to be reliable, but its accuracy and completeness cannot be guaranteed. Third party information may become outdated or otherwise superseded without notice. Neither the Securities and Exchange Commission (SEC) nor any other federal or state agency has approved, determined the accuracy, or confirmed the adequacy of this article.
The views and opinions expressed herein are those of the author and do not necessarily reflect the views of Alpha Architect, its affiliates or its employees. Our full disclosures are available here. Definitions of common statistics used in our analysis are available here (towards the bottom).
Join thousands of other readers and subscribe to our blog.

