Since the value of a company is the net present value of future cash flows, an accurate prediction of future earnings growth would appear to be the most important ingredient to successful valuation and stock selection. And because the discount rate (risk-free rate plus risk premium) for each company is already incorporated in its current valuation ratio, investors seeking high returns should invest in companies with both high discount rates and high future growth—diversifying the portfolio to minimize idiosyncratic (and, thus, uncompensated) risk.
Because almost all public companies in Japan provide full fiscal year forward guidance on revenue, operating income, and net income, the research team at Verdad was able to examine not only the accuracy of the growth predictions, but also whether they were useful, paired with valuation ratios, in predicting stock returns. To test the hypothesis, Verdad examined the last 20 years of data for all Japanese companies with fiscal years ending in March and compared growth guidance to realized growth and to realized returns. Realized growth rates were calculated as the year-over-year change in earnings. Growth guidance rates were similarly calculated but used forward guidance levels to estimate future earnings growth.
Accuracy of Management Forecasts
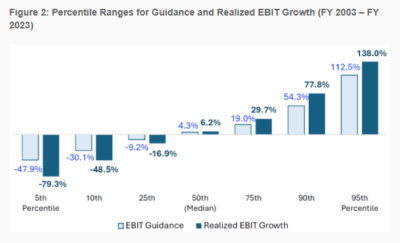
The evidence suggests that forward earnings guidance provided a good directional guide to EBIT (earnings before interest and taxes) growth that would be realized over the course of a fiscal year—the coefficient on guidance had a t-statistic of 65. They also found that the coefficient (beta) on guidance was 1.4—on average, realized EBIT growth was larger in magnitude than the corresponding guidance provided by management. This applied to both positive and negative outcomes, as shown in the chart below.
“When guidance and realized growth are both ranked by percentiles, we see that the range of outcomes is wider for realized growth compared to guidance. This suggests that management teams may publish growth forecasts they hope to beat when good news is expected, and they may be slow to communicate the extent of bad news when earnings declines are expected.”
In terms of the value of the forecasts to predicting stock returns, even accounting for the beta of 1.4, 84% of the variation in actual EBIT growth remained unexplained (the R-squared was just 16%).

The results are hypothetical results and are NOT an indicator of future results and do NOT represent returns that any investor actually attained. Indexes are unmanaged and do not reflect management or trading fees, and one cannot invest directly in an index.
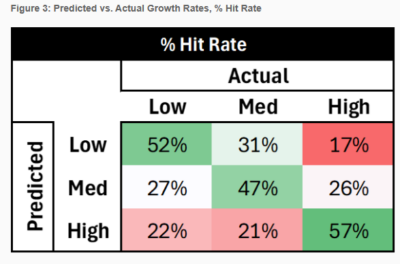
Verdad then sorted realized and predicted earnings growth into three buckets—“low,” “medium,” and “high” and found that Japanese companies were only about 50% accurate in predicting which bucket their earnings growth will fall into.

The results are hypothetical results and are NOT an indicator of future results and do NOT represent returns that any investor actually attained. Indexes are unmanaged and do not reflect management or trading fees, and one cannot invest directly in an index.
Forecasts are Too Noisy to Have Value
Perhaps Verdad’s most important finding was that while realized growth did correlate with equity returns, the linkage was “noisy”—the regression of 1-year forward stock return on 1-year forward realized growth produced a coefficient of just 0.2 (t-stat = 25). While, as we would expect, perfect foresight into future earnings growth would have provided some information toward predicting future returns, the R-squared was only 5%—95% of the variation in equity returns remained unexplained by earnings growth. Bottom line: even with perfect foresight into future earnings growth, there was still tremendous uncertainty involved in forecasting individual stock returns.
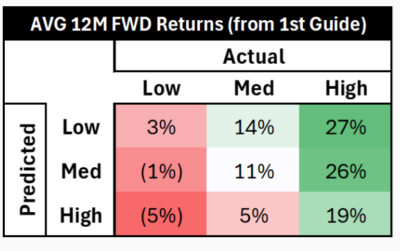
An unsurprising finding was that the market harshly penalized companies that projected high growth but realized low growth (average return: -5%) while rewarding companies with low growth projections that achieved high growth (average return: +27%). In fact, the empirical research (see “Forecasting Profitability and Earnings,” “Higgledy Piggledy Growth,” “Returns to E/P Strategies, Higgledy-Piggledy Growth, Analysts’ Forecast Errors, and Omitted Risk Factors,”“The Level and Persistence of Growth Rates,” and Persistence of Growth) shows that abnormal earnings growth tends to revert to the mean far faster than the market expects—helping to explain the source of the value premium.

The results are hypothetical results and are NOT an indicator of future results and do NOT represent returns that any investor actually attained. Indexes are unmanaged and do not reflect management or trading fees, and one cannot invest directly in an index.
Their findings led to Verdad to conclude:
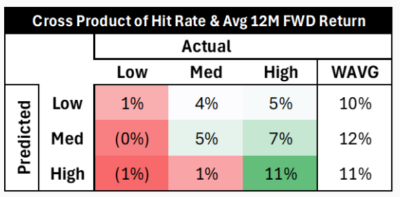
“It turns out, the hit rates are low enough on getting growth predictions right—and the market’s reaction to the upside and downside is so significant when predictions are wrong—that growth predictions don’t effectively predict stock returns at all. Regressing one-year forward return on one-year forward growth guidance yields an insignificant coefficient with an R-squared of 0%. The average forward one-year returns for companies in years when they guided for high, medium, and low growth were 11%, 12%, and 10%, respectively, showing no meaningful difference across projections. The average forward one-year returns for companies in years when they guided for high, medium, and low growth were 11%, 12%, and 10%, respectively, showing no meaningful difference across projections.”
They added: “So, does guidance guide us? It can help investors in terms of forward growth expectations, but not with predicting returns.”

The results are hypothetical results and are NOT an indicator of future results and do NOT represent returns that any investor actually attained. Indexes are unmanaged and do not reflect management or trading fees, and one cannot invest directly in an index.
The above table also shows that companies with low growth projections may offer some downside volatility protection—since low returns are already expected, there’s less room for negative surprises, making these companies potentially attractive for risk-averse investors.
Investor Takeaways
Among the many mistakes investors make is that they believe that the way to achieve high returns is to invest in companies, industries, and countries (see What’s Growth Got to Do with It? Equity Returns and Economic Growth,” and GDP Growth and Equity Returns (password protected)) that have high future growth rates, failing to consider that those high future expected growth rates are already built into the market’s expectations—while growth stock have produced faster growth in earnings, value stocks have provided higher returns.
The bottom line is that what matters is not the expectation of future growth, but the deviation between projected growth and realized growth, which, by definition is a surprise, and, thus, is not forecastable. In addition, because the market harshly penalizes companies that projected high growth but realized low growth, investors should minimize idiosyncratic risks. These insights, combined with the current historically high valuations of the Mag 7 stocks, should act as a cautionary warning to remember to focus not only on what is projected, but to remember that the market has already priced in expectations.
Larry Swedroe is the author or co-author of 18 books on investing, including his latest Enrich Your Future.
About the Author: Larry Swedroe
—
Important Disclosures
For informational and educational purposes only and should not be construed as specific investment, accounting, legal, or tax advice. Certain information is deemed to be reliable, but its accuracy and completeness cannot be guaranteed. Third party information may become outdated or otherwise superseded without notice. Neither the Securities and Exchange Commission (SEC) nor any other federal or state agency has approved, determined the accuracy, or confirmed the adequacy of this article.
The views and opinions expressed herein are those of the author and do not necessarily reflect the views of Alpha Architect, its affiliates or its employees. Our full disclosures are available here. Definitions of common statistics used in our analysis are available here (towards the bottom).
Join thousands of other readers and subscribe to our blog.

