Trend-following strategies are a lot like stock-picking strategies — there are endless approaches and varying levels of complexity. In this short piece, we explore the decision related to implementing basic trend-following strategies on either a daily or a monthly basis. Many traders intuitively believe that daily data is better than monthly data. Is this belief justified? Like most things in markets, there are generally no “correct” answers, but there are trade-offs. On one hand, using daily data may allow the trader to be more “responsive” to market action, however, on the other hand, this responsiveness may be drowned in false signals via so-called “whipsaws.”(1) I’ll argue — on both empirical and theoretical grounds — that there is little evidence to support the notion that daily data is better than lower frequency data. Alpha Architect is hosting some tools I’ve created that allow users to explore these ideas on their own terms. Sometimes “seeing is believing.”
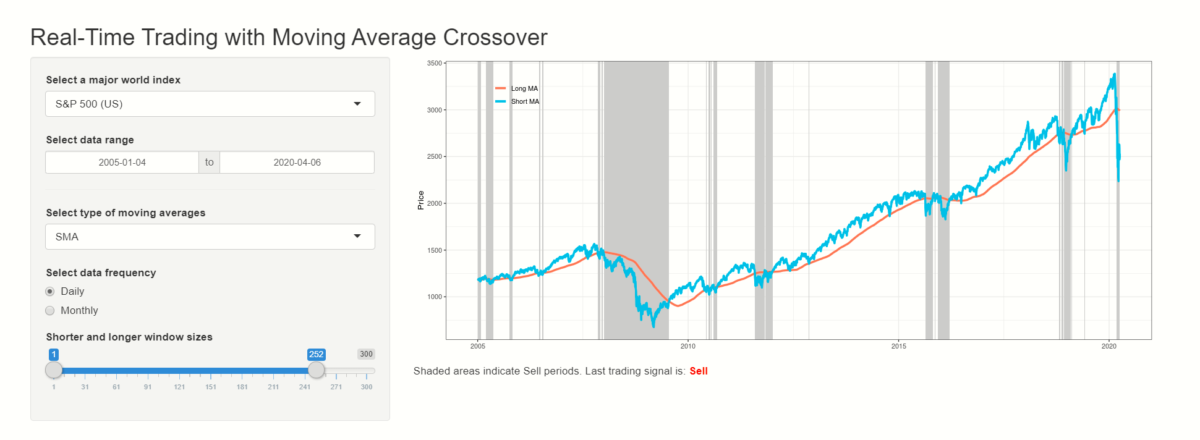
- You can access the daily-updated DIY trend-following tools here. (requires registration, which is free). Screenshot below. (AA will be updating with new features over time — so check in every so often).
Theoretical Discussions
Despite the ever-growing interest in trend following and a series of publications in academic journals, there is still a great shortage of theoretical results on the properties of trend following rules. To the best of my knowledge, no paper has ever analyzed the theoretical differences between trend following on a daily and a monthly basis.
My co-author Javier Giner and I are currently working on a theoretical framework for comparative analysis of various trend-following rules. Among other things, we suggest how to quantify the following three main properties of trend-following rules:
- Accuracy in detecting trend direction
- Delay in identifying trend turning points
- Expected number of trades
The reasons to consider these three main properties are as follows. When prices trend upward or downward, a trend following rule must accurately detect the trend direction. When the direction of trend changes, a trend following rule must quickly recognize this change. Finally, when prices go sideways, a trend following rule must have a low number of whipsaw trades.
We have preliminary results that allow us to compare the properties of trend-following rules based on single moving averages, MAC rules, and the Momentum rule. For example, our analysis suggests that the 10-month SMA rule relative to the popular 50- and 200-day SMA rule, has about the same accuracy in identifying trend direction, has a bit longer average lag time in detecting trend turning points, but has a fewer expected number of trades. However, the 30- and 200-day SMA rule has about the same properties as those of the 10-month SMA rule. These results suggest that from a theoretical point of view, monthly data is probably as good as daily data. Until we expand our theoretical framework, we will not be able to generate results for more complex trend rules such as the MAE rule. Stay tuned to my research and this blog for updates on what we are working on.
Empirical Evidence
Surprisingly, there are only a few academic studies that examine whether there is any advantage in trading using daily data versus monthly data.
Clare, Seaton, Smith, and Thomas (2013) use daily and monthly data on the S&P 500 index over the period from 1988 to 2011 and investigate this question utilizing the back-testing methodology. Among other rules, this study uses the Simple Moving Average (SMA) rule and the Moving Average Crossover (MAC) rule (based on the comparison of a set of SMA rules). The results of this study suggest that there is no advantage in trading on a daily basis rather than a monthly basis. In particular, regardless of the data frequency, the trading rules deliver about the same performance.
In my book (Zakamulin 2017, Chapters 9 and 10) I examine the same question using daily and monthly data on various US stock market indices over the period from 1944 to 2015 by employing both back-testing and forward-testing methodologies. This study uses single moving averages, MAC rules, Moving Average Envelope (MAE) rules, and the Momentum rule (i.e., “time-series momentum” or “absolute momentum”).
Here is a summary of the results:
- The results of this study suggest that, in back-tests, trend following on a daily basis produces marginally better performance than trend following on a monthly basis.
- In forward-tests, trend following on a daily basis has marginally worse performance than the monthly version. (see here for an explanation of backtests vs. forward tests)
- When monthly data on the S&P 500 index are used, 2- and 10-month MAC rule seems to be the best performing rule. The popular 10-month SMA rule also delivers strong historical performance.
- When daily data on various stock market indices are used, most often the best performing rule is the MAE rule. As an example, when daily data on the S&P 500 index are utilized, a 200-day SMA with a 3.5% envelope delivers notably better performance than the popular 50- and 200-day SMA crossover rule. The advantage of the MAE rule over the MAC rule seems to lie in its ability to generate earlier buy and sell signals when stock prices move sharply up or down.
Conclusions
The results of empirical studies and theoretical analysis suggest that there is no evidence that the performance of trend-following rules is better when daily data is used instead of monthly data. However, there are clear indications that, when daily data are used, the MAE rule performs better than the MAC rule.
The interested reader can compare and contrast the trading signals of the MAE and MAC rules on a daily and monthly basis using the interactive web applications:
- You can access a daily-updated DIY trend-following tool here. (requires registration, which is free). Screenshot below.
Good luck!
References
For a review of various trend-following rules click here
Clare, A., Seaton, J., Smith, P. N., and Thomas, S. (2013). “Breaking into the Blackbox: Trend Following, Stop Losses and the Frequency of Trading: The Case of the S&P500″, Journal of Asset Management, 14 (3), 182–194. Available online here.
Zakamulin (2017). “Market Timing with Moving Averages: The Anatomy and Performance of Trading Rules”, Palgrave Macmillan. Available here. The author’s web page for this book with many resources and interactive web illustrations is available here.

About the Author: Valeriy Zakamulin
—
Important Disclosures
For informational and educational purposes only and should not be construed as specific investment, accounting, legal, or tax advice. Certain information is deemed to be reliable, but its accuracy and completeness cannot be guaranteed. Third party information may become outdated or otherwise superseded without notice. Neither the Securities and Exchange Commission (SEC) nor any other federal or state agency has approved, determined the accuracy, or confirmed the adequacy of this article.
The views and opinions expressed herein are those of the author and do not necessarily reflect the views of Alpha Architect, its affiliates or its employees. Our full disclosures are available here. Definitions of common statistics used in our analysis are available here (towards the bottom).
Join thousands of other readers and subscribe to our blog.