This article explores the difference between tradable and on-paper (theoretical) risk factors in investing. Risk factors are strategies that help explain stock market returns, but many work only in theory and not in real life. Researchers developed ways to make these factors tradable by using mutual funds and ETFs, making them accessible to both large institutions and everyday investors. However, real-world costs like trading fees and shorting expenses can reduce returns by 2% to 4% each year. Understanding these costs helps investors make smarter decisions when choosing investment strategies.
Tradable Risk Factors for Institutional and Retail Investors
- Andreas Johansson, Riccardo Sabbatucci, and Andrea Tamoni
- Review of Finance, 2025
- A version of this paper can be found here
- Want to read our summaries of academic finance papers? Check out our Academic Research Insight category
Key Academic Insights
Tradable vs. Theoretical Factors: Many investment strategies show great results in studies, but they are hard to use in real life due to trading costs and market restrictions.
Making Factors Investable: The study shows how investors can use mutual funds and ETFs to access risk factors that were previously only theoretical. We previously explored this challenge in a piece questioning whether academic factor portfolios are actually usable for investors.
Real-World Costs Matter: Trading fees, shorting costs, and other expenses reduce returns by 2% to 4% per year, making it crucial to account for these costs. We have written an article offering a detailed discussion on how implementation costs after real-world results.
Shorting Costs Are a Major Issue: The cost of shorting stocks makes up 58% of the difference between expected (theoretical) and actual (tradable) returns.
Practical Applications for Investment Advisors
Educate Clients on Costs: Help clients understand how fees and trading expenses affect their returns, especially when investing in complex strategies.
Optimize Investment Choices: Choose ETFs and mutual funds that align with risk factor strategies while minimizing unnecessary costs.
Implement Cost-Aware Strategies: Use real-world data to build strategies that account for trading costs and deliver better net returns.
How to Explain This to Clients
“Some investment strategies look great on paper but don’t work as well in real life because of trading costs. By choosing investments that account for these costs—like carefully selected ETFs and funds—we can create a strategy that actually works for you, not just in theory.“
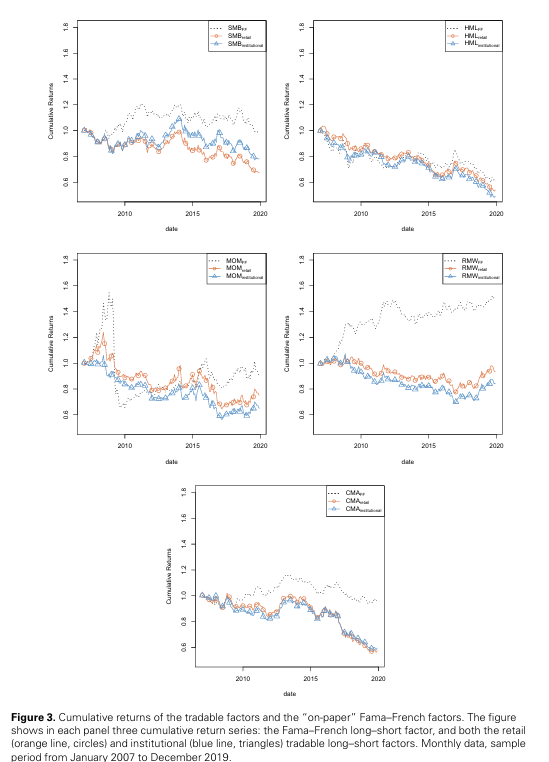
The Most Important Chart from the Paper
This table visually demonstrates the performance differences between traditional “on-paper” risk factors and their tradable counterparts. The figure highlights the annual performance gap, known as the implementation shortfall, which ranges from 2% to 4%. This shortfall arises due to real-world costs like shorting fees and transaction expenses.
The results are hypothetical results and are NOT an indicator of future results and do NOT represent returns that any investor actually attained. Indexes are unmanaged and do not reflect management or trading fees, and one cannot invest directly in an index.
Abstract
We construct tradable risk factors using combinations of large and liquid mutual funds (long leg) and ETFs (exchange-traded funds) (long and short legs), based on their holdings, for both retail and institutional investors. Exploiting a novel dataset, our tradable factors take into account ETF shorting costs. Assessing the performance of our tradable factors against standard “on-paper” factors, we uncover an implementation shortfall of 2–4 percent annually. Shorting fees and transaction costs contribute to 58 percent of the performance differential between tradable and “on-paper” factors, assigning a non-trivial role to the opportunity cost of not trading the exact “on-paper” portfolio.

About the Author: Elisabetta Basilico, PhD, CFA
—
Important Disclosures
For informational and educational purposes only and should not be construed as specific investment, accounting, legal, or tax advice. Certain information is deemed to be reliable, but its accuracy and completeness cannot be guaranteed. Third party information may become outdated or otherwise superseded without notice. Neither the Securities and Exchange Commission (SEC) nor any other federal or state agency has approved, determined the accuracy, or confirmed the adequacy of this article.
The views and opinions expressed herein are those of the author and do not necessarily reflect the views of Alpha Architect, its affiliates or its employees. Our full disclosures are available here. Definitions of common statistics used in our analysis are available here (towards the bottom).
Join thousands of other readers and subscribe to our blog.