Stock markets have been sucking wind recently.
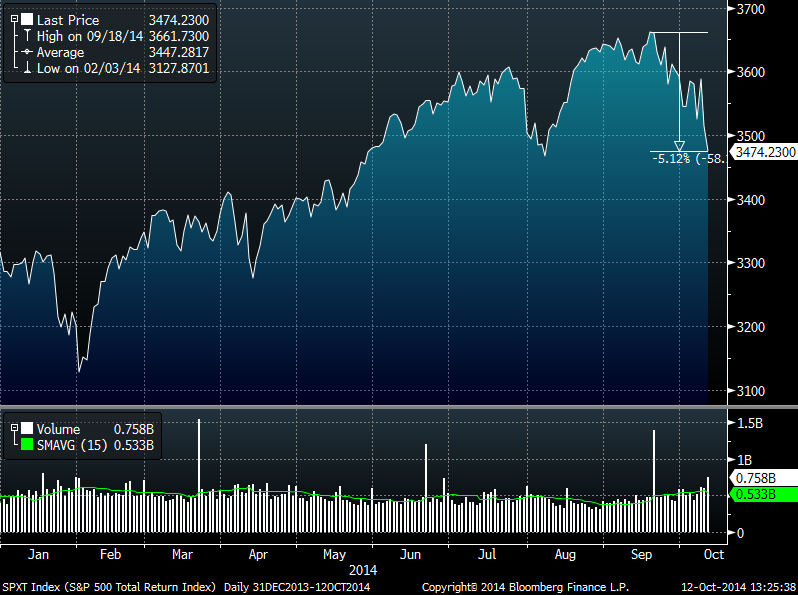
S&P
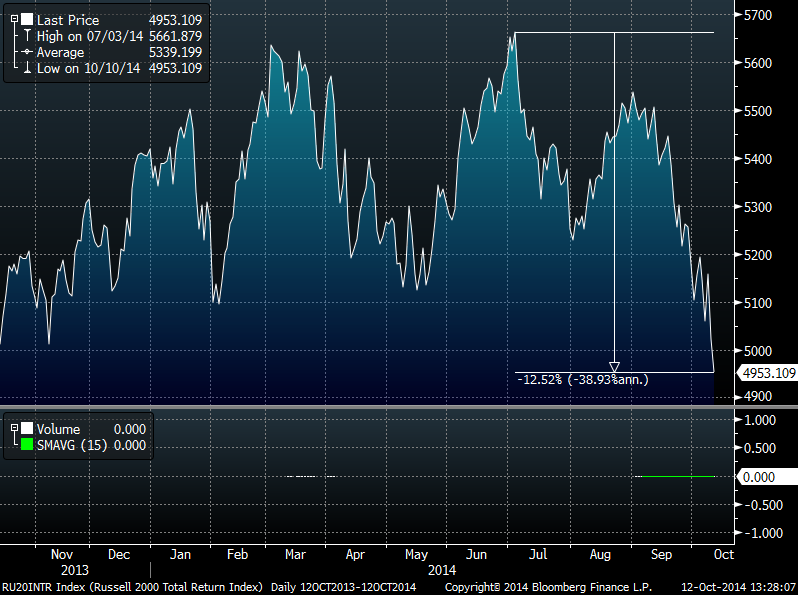
R2K
When I listen to the nightly news or indulge in 30 seconds of CNBC during the day, it seems as though the world is coming apart at the seams.
Perhaps a correction is on the horizon, and with a long enough horizon there is a 100% probability the market will blow up (e.g., the sun becomes a Red Giant and the Earth is liquidated).
But when consuming information we must always worry about availability bias, which causes our minds to overweight the probability of events that trigger primal instincts such as fear and greed.
Some headlines:
- Earnings Season Marred as S&P 500 Falls Most Since 2009 (but stocks really haven’t done anything but go up since 2009. Marred? Are we talking about the Battle of Fallujah?)
- Whipsawing Wall Street sends markets to biggest turnaround in almost 3 years (Whipsawing? Are we in a car accident?)
- World stock markets slide as bad news mounts up: Fears of a global economic slowdown, tensions in the Middle East and the spread of the Ebola virus weighed on world shares. (Turmoil in the Middle East? Ebola? Are you serious? Ever been to the Middle East or rural Africa? This is old news.)
- Markets in Chaos (Really? If this is chaos, refer to the table below. How would we describe a real market drawdown? Death by a thousand cuts?)
But just how big a deal is a 5% loss in the stock market?
The table below highlights the top 40 worst drawdowns from 1927 to 2013–all of them are worse than 5%.
We include the S&P 500 total return index (Large cap) and the Equal-weight CRSP total return index (small-cap).
One thing is clear:
INVESTING IN THE STOCK MARKET IS INCREDIBLY RISKY
| Rank | Date Start | Date End | SP500 | EW_CRSP |
| 1 | 8/30/1929 | 5/31/1932 | -84.59% | -85.86% |
| 2 | 2/27/1937 | 3/31/1938 | -51.27% | -61.18% |
| 3 | 10/31/2007 | 2/28/2009 | -50.21% | -55.19% |
| 4 | 8/31/2000 | 9/30/2002 | -44.41% | -23.78% |
| 5 | 12/31/1972 | 9/30/1974 | -42.73% | -49.86% |
| 6 | 8/31/1932 | 2/28/1933 | -30.38% | -38.68% |
| 7 | 9/30/1939 | 4/30/1942 | -29.81% | -21.00% |
| 8 | 8/31/1987 | 11/30/1987 | -29.58% | -32.02% |
| 9 | 11/30/1968 | 6/30/1970 | -29.23% | -48.32% |
| 10 | 12/31/1961 | 6/30/1962 | -22.33% | -23.03% |
| 11 | 5/31/1946 | 11/30/1946 | -22.17% | -28.13% |
| 12 | 1/31/1934 | 3/30/1935 | -21.89% | -23.08% |
| 13 | 8/31/1933 | 10/31/1933 | -19.76% | -24.17% |
| 14 | 12/31/1938 | 4/29/1939 | -17.01% | -20.28% |
| 15 | 11/30/1980 | 7/31/1982 | -16.53% | -12.82% |
| 16 | 4/30/2011 | 9/30/2011 | -16.26% | -22.15% |
| 17 | 1/31/1966 | 9/30/1966 | -15.79% | -15.70% |
| 18 | 6/30/1998 | 8/31/1998 | -15.18% | -23.70% |
| 19 | 7/31/1957 | 12/31/1957 | -15.13% | -18.37% |
| 20 | 5/31/1990 | 10/31/1990 | -14.82% | -24.33% |
| 21 | 12/31/1976 | 2/28/1978 | -14.46% | 25.53% |
| 22 | 4/30/2010 | 6/30/2010 | -12.93% | -13.54% |
| 23 | 7/31/1956 | 2/28/1957 | -9.90% | -3.90% |
| 24 | 2/29/1980 | 3/31/1980 | -9.75% | -16.50% |
| 25 | 8/31/1978 | 10/31/1978 | -9.43% | -17.22% |
| 26 | 12/31/1952 | 8/31/1953 | -9.01% | -5.88% |
| 27 | 6/30/1943 | 11/30/1943 | -8.81% | -11.80% |
| 28 | 12/31/1959 | 4/30/1960 | -8.42% | -7.38% |
| 29 | 8/31/1986 | 9/30/1986 | -8.32% | -5.91% |
| 30 | 4/30/1971 | 10/31/1971 | -7.87% | -13.65% |
| 31 | 3/31/1936 | 4/30/1936 | -7.78% | -12.30% |
| 32 | 11/30/1983 | 5/31/1984 | -7.21% | -12.44% |
| 33 | 1/31/1994 | 3/31/1994 | -6.95% | -5.55% |
| 34 | 12/31/1989 | 1/31/1990 | -6.77% | -4.64% |
| 35 | 12/31/1967 | 2/29/1968 | -6.77% | -3.36% |
| 36 | 3/31/2012 | 5/31/2012 | -6.60% | -7.69% |
| 37 | 9/30/1979 | 10/31/1979 | -6.56% | -9.79% |
| 38 | 1/31/1946 | 2/28/1946 | -6.54% | -6.69% |
| 39 | 6/30/1999 | 9/30/1999 | -6.22% | -3.75% |
| 40 | 3/31/1956 | 5/31/1956 | -5.90% | -3.63% |
The results are hypothetical results and are NOT an indicator of future results and do NOT represent returns that any investor actually attained. Indexes are unmanaged, do not reflect management or trading fees, and one cannot invest directly in an index. Additional information regarding the construction of these results is available upon request.
Knowledge is power and knowing the facts regarding the risks associated with stock market investing can help you put the current market movements in context. Does losing 5%+ stink? Of course.
But is the movement worthy of stirring behavioral emotions (e.g. fear or greed) that will almost certainly cause you to make a bad decision? Not even close!
- Stay calm.
- Stick to your program.
- Never associate more activity with increased value.
- Focus on evidence, not on stories.
- Avoid television, which is systematically designed to trigger emotions that cause you to “react.”
- Avoid advisors who recommend off-the-cuff “tactical changes.” These tactical changes justify an overpriced existence, but rarely equate to systematic value-add.
- Avoid the stock market if you cannot take risk!

About the Author: Wesley Gray, PhD
—
Important Disclosures
For informational and educational purposes only and should not be construed as specific investment, accounting, legal, or tax advice. Certain information is deemed to be reliable, but its accuracy and completeness cannot be guaranteed. Third party information may become outdated or otherwise superseded without notice. Neither the Securities and Exchange Commission (SEC) nor any other federal or state agency has approved, determined the accuracy, or confirmed the adequacy of this article.
The views and opinions expressed herein are those of the author and do not necessarily reflect the views of Alpha Architect, its affiliates or its employees. Our full disclosures are available here. Definitions of common statistics used in our analysis are available here (towards the bottom).
Join thousands of other readers and subscribe to our blog.