Christian Goulding and Campbell Harvey, authors of the study “Investment Base Pairs,” proposed a groundbreaking framework for portfolio construction that challenges traditional approaches in modern finance. Their research focused on leveraging cross-asset information to optimize investment strategies and improve returns across diverse asset classes. Here’s an overview of their investigation, key findings, and takeaways for investors and advisors.
What Did the Authors Investigate?
The study critiques the limitations of conventional portfolio construction techniques, such as quantile-based sorting (e.g., long top 30%/short bottom 30%) and linear weighting schemes. These methods, while widely used, fail to account for valuable cross-asset information.
To address this gap, the authors:
- Decomposed common investment signals—value, momentum, and carry—into “base pair” portfolios.
- Examined how cross-asset predictability, signal correlations, and imbalances in signal mean and variance influence portfolio performance, enabling the exploitation of interdependencies between asset classes such as equities, bonds, currencies, and commodities.
- Tested their approach using 1,710 futures pair portfolios built from 64 liquid futures and forwards markets across four asset classes and three signal types: 15 equity indices, 13 bonds, 9 currencies, and 27 commodities.
Their data covered the period January 1985 to September 2023.
“Given low transaction costs, high liquidity, and substantial histories of these futures, this dataset provides a rich setting to study the diversity of signal-driven investing, covering 12 major strategy categories Equity Value, Bond Value, Currency Value, Commodity Value, Equity Momentum, Bond Momentum, Currency Momentum, Commodity Momentum, Equity Carry, Bond Carry, Currency Carry, Commodity Carry and several aggregate categories by asset class, signal type, and also an “All” category.”
They emphasized identifying and targeting high performing “base pairs” while eliminating underperforming or “junk” pairs. Their methodology included each asset’s signal not only correlating with its subsequent return (own-asset effect), but also potentially correlating with the other asset’s signal and return (cross-asset effect), and signals having persistence differences in average levels or variability.
The following is a summary of their key findings:
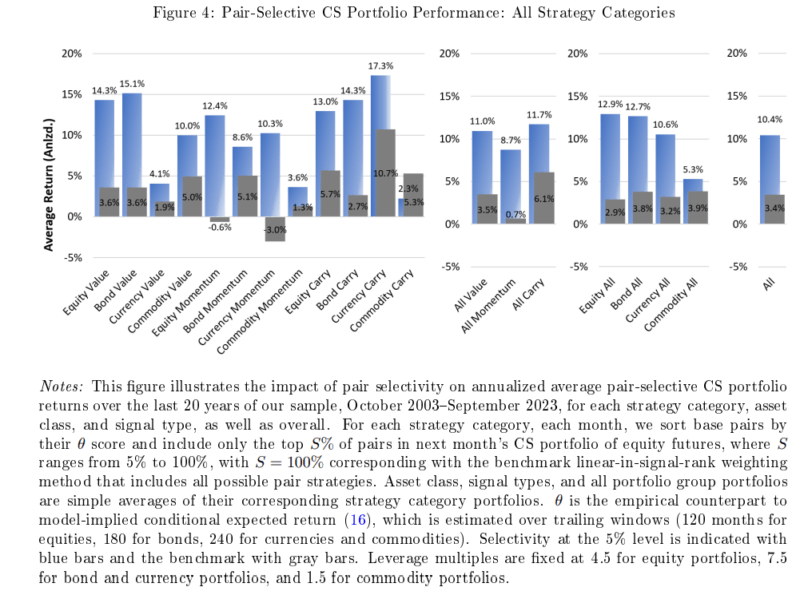
- Enhanced Returns Through Base Pair Portfolios: The proposed approach significantly outperformed traditional methods. For example:
- The aggregate “All” portfolio’s annualized return increased from 3.4% to 10.4%.
- Equity Value returns surged from 3.6% to 14.3%.
- Currency Momentum reversed a loss of -3.0% to a gain of 10.3%.
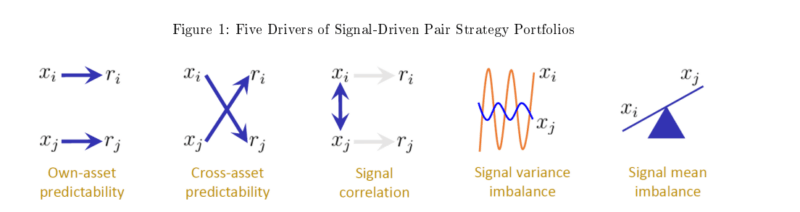
- Drivers of Performance: The improved results stem from harnessing five key drivers:
- Own-asset predictability: How well signals predict returns within the same asset.
- Cross-asset predictability: How signals predict returns across different assets.
- Signal correlation: Relationships between signals across assets.
- Signal mean imbalance: Differences in average signal strength.
- Signal variance imbalance: Variability in signal strength.
The results are hypothetical results and are NOT an indicator of future results and do NOT represent returns that any investor actually attained. Indexes are unmanaged and do not reflect management or trading fees, and one cannot invest directly in an index.
Notes: This figure illustrates the five drivers of signal-driven pair strategy portfolio returns: own-asset predictability, cross-asset predictability, signal correlation, signal mean imbalance, and signal variance imbalance. xi and xj denote the signals on assets i and j at date t, respectively, with ri and rj denoting their returns at date t + 1. The blue arrows indicate correlations. The waves (orange and blue) indicate time-variation in signals. The blue wedge indicates systematic differences in the levels of the signals. Each driver reflects a distinct mechanism influencing performance, as derived in Section 2.
- Robustness Across Asset Classes: The methodology proved effective across equities, bonds, currencies, and commodities, demonstrating its robustness.
- Eliminating Noise: By discarding “junk” pairs (low-performing combinations), the approach enhanced signal quality and reduced portfolio drag.
The results are hypothetical results and are NOT an indicator of future results and do NOT represent returns that any investor actually attained. Indexes are unmanaged and do not reflect management or trading fees, and one cannot invest directly in an index.
The results are hypothetical results and are NOT an indicator of future results and do NOT represent returns that any investor actually attained. Indexes are unmanaged and do not reflect management or trading fees, and one cannot invest directly in an index.
Validation of the Model
Goulding and Harvey found:
“Strong validation of the model: across 126,286 observations, our empirical counterpart to the model’s steady-state pair strategy return, θ, contemporaneously explains 63.7% of long-term average return variation, with a highly significant beta of 0.984 (p-value ≈ 0) and a tiny intercept of 0.0008. A beta near 1 and a negligible intercept suggest that θ captures the long-term average return cross section at the broadest group level approximately 1:1, with only about one-third of the variation not captured by our model.” They also found “that pair portfolios are not just heterogeneous in performance; they are also very heterogeneous in what drives them. For example, own-asset effects contribute 37-51% across most groups, but range from 34.9% in Equity Carry to 83.1% in Currency Value. Cross-assets effects contribute 32-49% across most groups but range from 14.0% in Currency Value to 54.6% in Bond Carry. Signal biases and high signal correlations drive many strategy categories through unexplained effects—linked to model intercepts—the parts of their assets’ mean returns not attributable to signal predictability.”
Their findings led Goulding and Harvey to conclude:
“Our findings have important implications for asset pricing theory. The prominence of cross-asset effects, contributing substantial return variation, challenges the assumption that returns are primarily driven by own-asset risk factors, as posited by models like Fama and French (2015). This suggests that inter-asset dependencies play a larger role in signal-driven returns than previously thought. The signal imbalances, such as mean and variance biases, further unlock the picture, capturing the extent to which returns may reflect systematic biases in signal construction rather than risk premia.” They added: “Interactions between assets, alongside disparities in signal averages and volatilities, expose underlying forces that conventional approaches miss, hinting that returns may partly reflect signal design rather than pure risk compensation.”
How does the “base pair” portfolio construction method improve returns compared to traditional methods?
The “base pair” portfolio construction method improves returns compared to traditional methods by leveraging cross-asset information and refining signal-driven strategies. The key improvements were:
- Decomposition of Investment Signals: Traditional methods like quantile sorting (e.g., long top 30%/short bottom 30%) discard critical cross-asset information. The base pair method decomposes signals such as value, momentum, and carry into “base pair” portfolios, enabling a more granular approach to portfolio construction.
- Harnessing Cross-Asset Predictability: This method incorporates cross-asset relationships, allowing signals from one asset class to predict returns in another. This adds a layer of insight that traditional own-asset-focused approaches lack.
- Targeting High-Performing Pairs: By identifying and focusing on top-performing pairs while eliminating “junk” pairs (low-performing combinations), the strategy reduces noise and enhances portfolio quality.
Comparison with Traditional Methods
| Aspect | Traditional Methods | Base Pair Method |
| Signal Utilization | Focuses on own-asset signals | Incorporates cross-asset signals |
| Portfolio Construction | Quantile sorting or linear weighting | Decomposed signal-driven pairs |
| Return Optimization | Moderate returns | Tripled average returns |
| Noise Reduction | Retains low-signal quality | Eliminates “junk” pairs |
How does the elimination of “junk” pairs contribute to the overall performance of the portfolios?
The elimination of “junk” pairs contributes to the overall performance of portfolios by improving signal quality, reducing noise, and enhancing risk-adjusted returns.
Here’s how:
1. Enhancing Signal Precision
- “Junk” pairs represent asset combinations with weak or unreliable predictive signals. By removing these pairs, the portfolio construction focuses solely on high-performing pairs with strong cross-asset predictability and robust signal strength. This refinement leads to more accurate investment decisions.
2. Reducing Portfolio Drag
- Low-performing or noisy pairs dilute the impact of high-quality signals, dragging down overall portfolio returns. Eliminating these pairs ensures that only the most effective signals contribute to portfolio performance, thereby boosting returns.
3. Improving Risk-Adjusted Returns
- Junk pairs often introduce unnecessary volatility or risk without corresponding rewards. By discarding them, the portfolio achieves better risk-adjusted returns, as it concentrates on combinations that offer consistent and reliable performance.
4. Optimizing Diversification
- Removing junk pairs helps avoid over-diversification into unproductive areas. The strategy focuses on meaningful diversification driven by cross-asset synergies rather than spreading investments across weak or irrelevant asset combinations.
5. Streamlining Portfolio Construction
- The elimination process simplifies portfolio construction, making it easier to identify and allocate resources to high-value opportunities across asset classes like equities, bonds, currencies, and commodities.
What specific asset classes benefited the most from this new approach?
The “base pair” portfolio construction method benefits multiple asset classes, but certain classes stand out as particularly well-suited to this approach due to their inherent characteristics and the ability to leverage cross-asset relationships. Here are the specific asset classes that benefit the most:
1. Equities
- Why It Benefits: The method enhances equity performance by targeting high-performing pairs within value, momentum, and carry signals. For instance, equity value returns increased significantly (from 3.6% to 14.3%) when using the base pair approach.
- Cross-Asset Advantage: Equities often exhibit strong interrelationships with other asset classes, such as bonds and commodities, which can be exploited for better diversification and return optimization.
2. Currencies
- Why It Benefits: Currency momentum strategies, which traditionally face challenges due to high volatility and noise, saw dramatic improvements under this method (e.g., turning a -3.0% loss into a 10.3% gain).
- Cross-Asset Advantage: Currencies are highly interconnected with macroeconomic factors like interest rates and commodity prices, making them ideal for cross-asset predictability.
3. Commodities
- Why It Benefits: Commodities often exhibit unique return drivers (e.g., supply/demand dynamics) that differ from equities and bonds. The base pair method helps isolate high-performing commodity pairs while filtering out “junk” combinations.
- Cross-Asset Advantage: Strong linkages with currencies (e.g., oil with USD) and equities (e.g., mining stocks) enhance the ability to optimize performance using cross-asset information.
4. Fixed Income (Bonds)
- Why It Benefits: Bonds benefit from the method’s ability to capture cross-asset correlations with equities and currencies, particularly in environments where interest rate changes drive performance.
- Cross-Asset Advantage: The relationship between bond yields and equity markets provides opportunities for diversification and return enhancement.
Key Takeaway
The “Investment Base Pairs” paper introduced a transformative way to think about portfolio construction by emphasizing cross-asset relationships and signal decomposition that offers a more nuanced way to capture information from cross-asset relationships. It will be interesting to see if systematic, quant fund sponsors incorporate this intriguing methodology into their fund construction rules.
Larry Swedroe is the author or co-author of 18 books on investing, including his latest Enrich Your Future.

About the Author: Larry Swedroe
—
Important Disclosures
For informational and educational purposes only and should not be construed as specific investment, accounting, legal, or tax advice. Certain information is deemed to be reliable, but its accuracy and completeness cannot be guaranteed. Third party information may become outdated or otherwise superseded without notice. Neither the Securities and Exchange Commission (SEC) nor any other federal or state agency has approved, determined the accuracy, or confirmed the adequacy of this article.
The views and opinions expressed herein are those of the author and do not necessarily reflect the views of Alpha Architect, its affiliates or its employees. Our full disclosures are available here. Definitions of common statistics used in our analysis are available here (towards the bottom).
Join thousands of other readers and subscribe to our blog.