Source: Getty Images. Invesco.
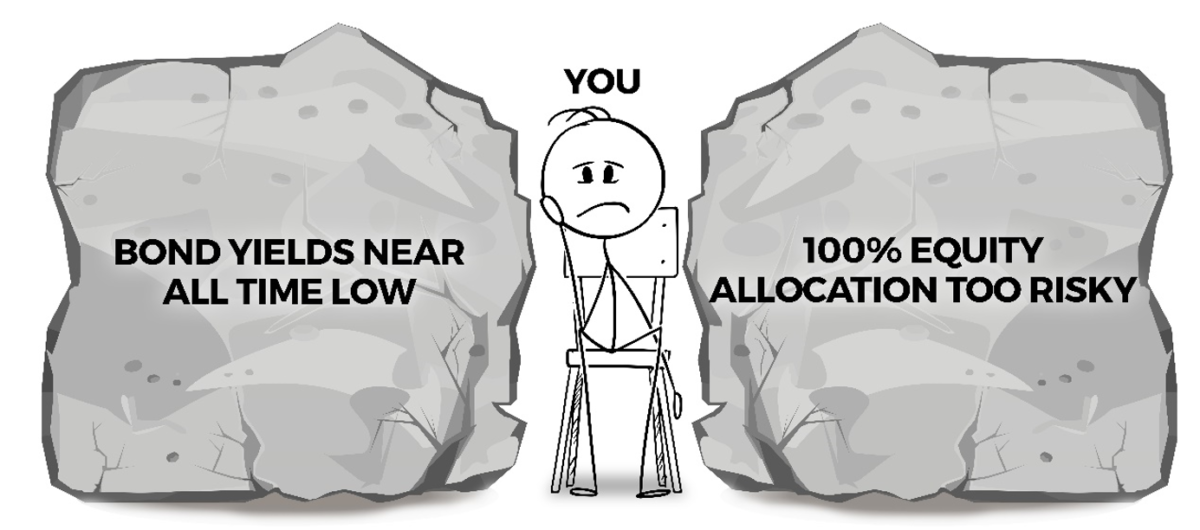
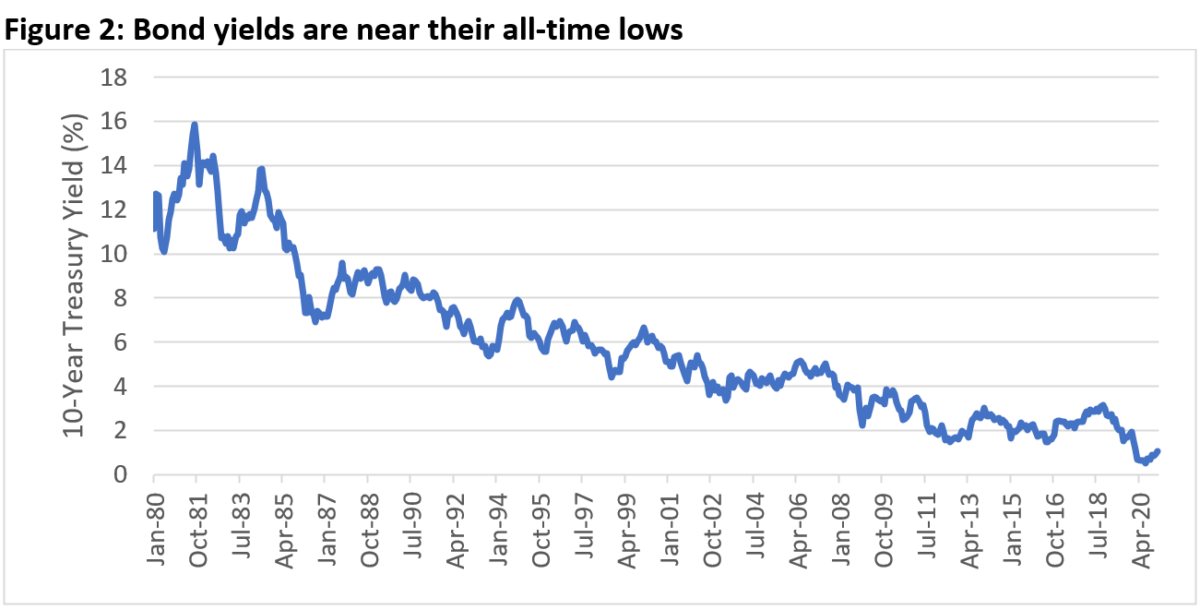
Investors are stuck between a rock and a hard place. On one hand, it is painful to buy bonds that deliver paltry yields near all-time lows (Figure 2). On the other hand, many investors’ risk tolerance, compliance guidelines or liabilities preclude them from reducing their fixed income allocations. While there is likely no panacea for this dilemma, fixed income factors may offer incremental solutions that can help investors better achieve their investment goals.
This is a two-part series. Part 1 defines fixed income factors and provides a deep dive into portfolio construction. Part 2 describes a case study showing how fixed-income factors can be used to solve practical issues that investors face in a low yield environment.
The results are hypothetical results and are NOT an indicator of future results and do NOT represent returns that any investor actually attained. Indexes are unmanaged, do not reflect management or trading fees, and one cannot invest directly in an index.
What are fixed income factors?
Each dot in Figure 3 represents a bond in the high yield market.(1) The chart contains about 2000 corporate bonds as of November 2020, all rated below investment grade (below BBB-). The colored dots represent “factor bonds” plotted along two dimensions familiar to fixed income investors – yield and credit rating.
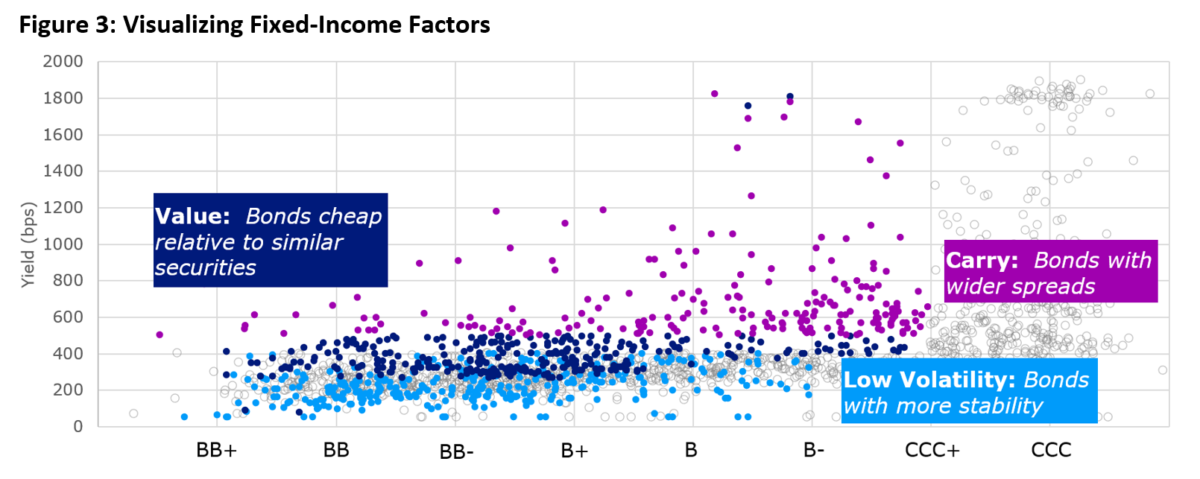
The light blue dots represent low volatility bonds. We find these securities tend to have higher risk-adjusted return potential with more stability than the broad market and a similar return profile over long periods of time. They tend to be lower yielding and higher credit quality than the index and have a shorter time to maturity(3).
The purple dots represent carry bonds. Carry bonds are the highest yielding, widest spread bonds within the universe. We find these securities tend to have higher returns over time and greater risk. These bonds typically have longer maturities, lower credit ratings and are in sectors with the widest spreads. They tend to be the riskiest bonds within the universe.
The dark blue dots represent value bonds. Value and carry are similar in their tendency to target higher yielding securities. Value bonds, however, have high yields relative to similar securities. In other words, when the universe is grouped based on rating, sector and duration, value bonds are the widest spread securities in each bucket.
Figure 4 shows the historical returns from 2000 to 2020 of the three groups of bonds in Figure 3, demonstrating that factors have worked in both investment grade and high yield. Figure 4 shows that value and carry bonds tended to outperform the broad market during this period. Low volatility securities tended to perform in line with the broad market with only 60%-70% of the volatility.
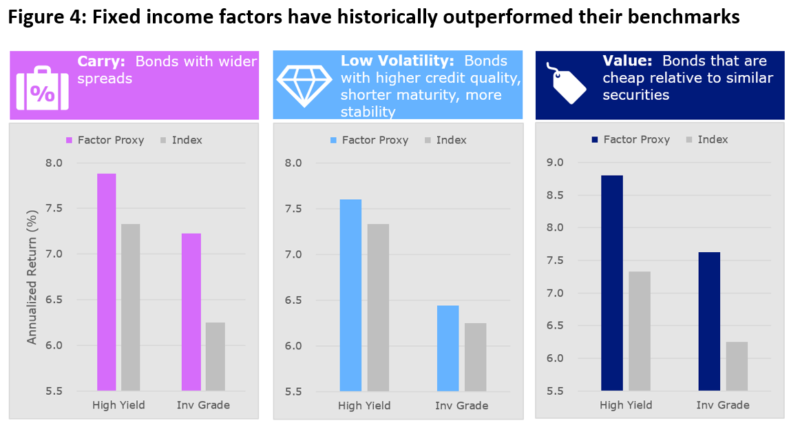
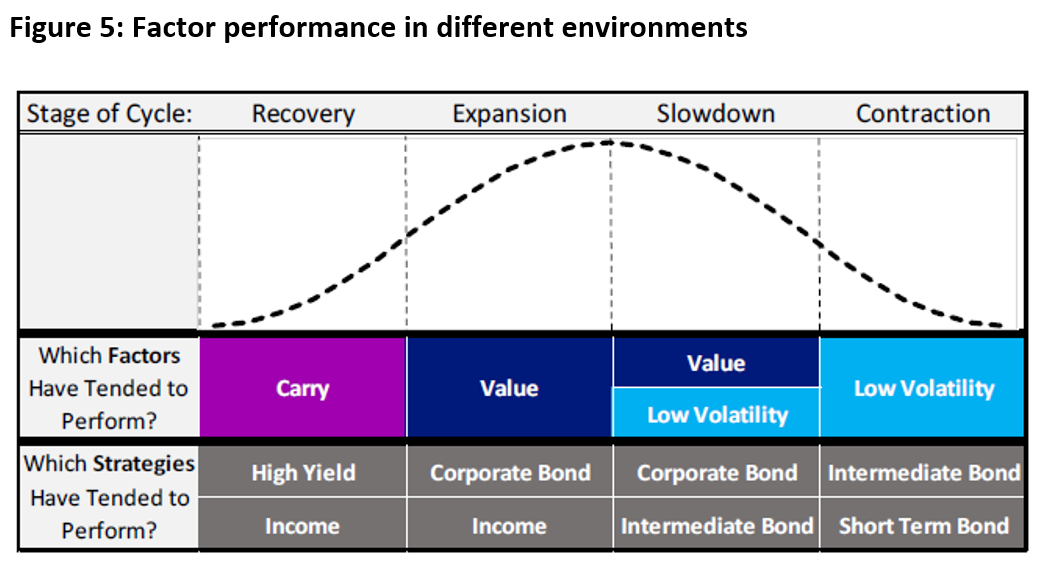
Figure 4 shows the average performance of the three types of factor bonds over a long period of time. Like other financial assets, the historical performance of factor bonds has varied depending on the environment. Figure 5 shows how the factor bonds have performed in different environments. Broadly speaking, value and carry bonds tended to be more” risk-on”, or tended to perform well when higher-yielding fixed income asset classes (correlated to stocks) delivered a strong performance. Low volatility bonds tended to outperform the broad market when equities sold off.
Conclusion
Fixed income factors are simply groups of bonds that have tended to exhibit specific performance characteristics over time. Although they are quite straightforward, they will not magically solve investor problems – an investor’s specific challenges and constraints must be considered when determining how factor-based strategies might provide an investment solution. In Part 2 of this two-part series, we highlight how investors could use fixed income factors to help solve the dilemma highlighted above: investing in fixed income in a low yield environment.
Appendix: Details of factor construction
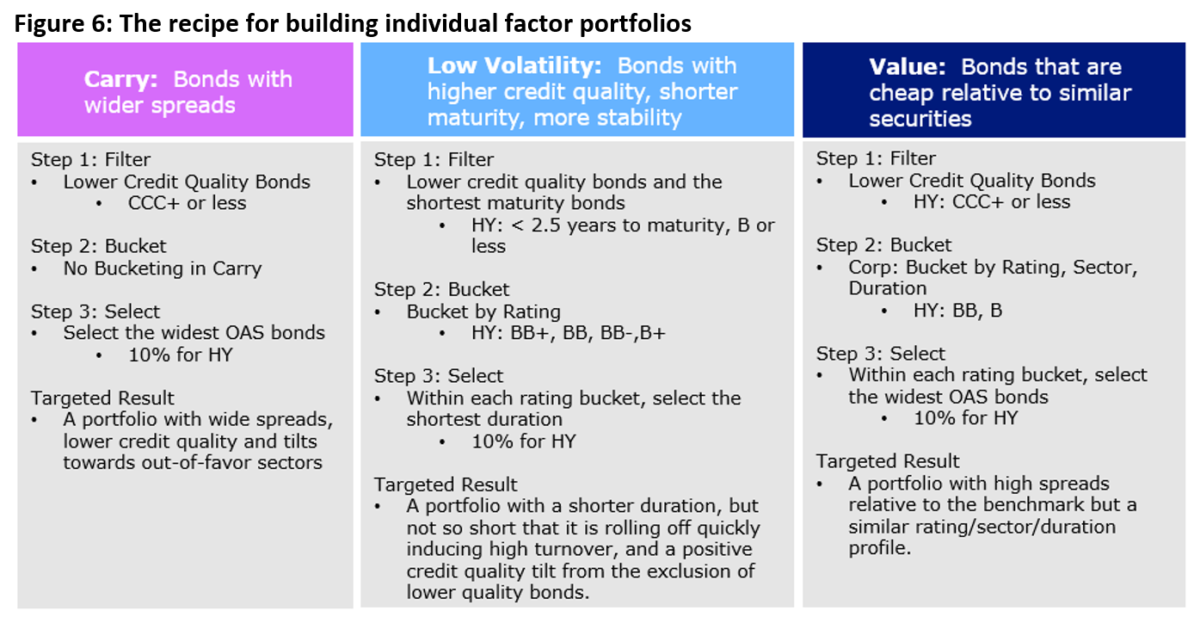
To build individual factor portfolios, we utilize a non-parametric filtering and bucketing process. The starting universe for each factor is the Bloomberg Barclays High Yield (2% Capped) Index.
To construct the carry factor, we filter out bonds rated CCC+ and below. We do this because we find that the primary metric we utilize to define carry, option-adjusted spread (OAS), is not a good indicator of credit quality for very low quality, high yield bonds. After filtering out those securities, we create a portfolio of bonds in the top 10% of the filtered universe in terms of spread. Those securities are then weighted based on face-value, which is the bond equivalent of capitalization weighting in equities. We do not control for rating, sector, or duration. This portfolio is rebalanced monthly(4).
To construct the value factor, we filter out bonds rated CCC+ and below for the same reason as in the construction of the carry factor. We then create buckets based on rating, sector, and duration. Within each bucket, we select the bonds in the top 10% in terms of OAS. We combine the buckets and weight securities based on face-value. This produces a portfolio with a similar rating, sector, and duration profile as the benchmark, but with a higher OAS. This portfolio is rebalanced monthly.
To construct the low volatility factor, we filter out securities with time-to-maturity of 2.5 years or less and those with a rating of single-B or less. We then create four rating buckets: BB+, BB, BB- and B+. Within each bucket, we select the top 10% of securities in terms of the shortest time-to-maturity (around 2.5 years) and combine the buckets. The resulting portfolio has a shorter duration than the benchmark and a higher credit quality. We find that this filtering process tends to provide a good proxy for the lowest volatility portfolio(5). This portfolio is rebalanced monthly.

References[+]
| ↑1 | To represent the broad high yield market, we use the Bloomberg Barclays US High Yield 2% Issuer Capped Bond Index. This is also defined as the broad market or the universe. |
|---|---|
| ↑2 | For details about the construction of each factor, please see the Appendix. |
| ↑3 | Shorter time-to-maturity leads to shorter duration, which leads to less price sensitivity to changes in interest rates or credit spreads, which mechanically drives the lower volatility of these bonds. |
| ↑4 | To implement a carry (or value or low volatility) strategy in practice, an investor could refrain from selling securities each time they moved out of the top 10% of carry bonds and only sell when a security moves outside of the 15% or 20% of widest spread bonds in the universe, for example. This would produce a portfolio with similar characteristics as the raw carry factor but would mitigate turnover. This is important in the high yield market in which implementation costs can erode the potential premiums associated with factors. |
| ↑5 | We do not merely buy the securities with the lowest historical volatilities because many of the securities in the current index may have not existed within the window of backward-looking volatility. For example, there was only a 57% overlap between the names in the high yield index on Dec. 31, 2020, and Dec. 31, 2019. |
About the Author: Ward Bortz
—
Important Disclosures
For informational and educational purposes only and should not be construed as specific investment, accounting, legal, or tax advice. Certain information is deemed to be reliable, but its accuracy and completeness cannot be guaranteed. Third party information may become outdated or otherwise superseded without notice. Neither the Securities and Exchange Commission (SEC) nor any other federal or state agency has approved, determined the accuracy, or confirmed the adequacy of this article.
The views and opinions expressed herein are those of the author and do not necessarily reflect the views of Alpha Architect, its affiliates or its employees. Our full disclosures are available here. Definitions of common statistics used in our analysis are available here (towards the bottom).
Join thousands of other readers and subscribe to our blog.