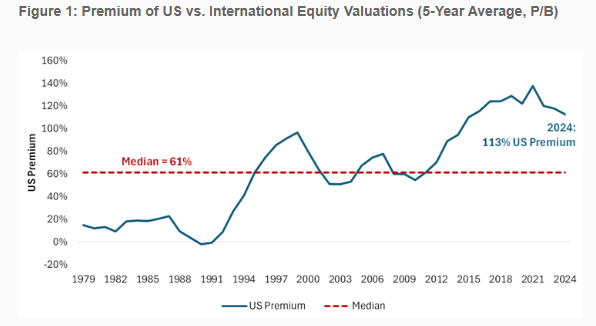
The post-GFC period has seen two major divergences in valuations that has led to divergences in performance. The one that has received the most attention has been the widening of the spread in valuations between growth and value stocks, explaining all the outperformance of growth stocks over the period. The other has been the widening of the valuation spread between US and international stocks. The following chart shows that while the US valuation premium relative to international equities has averaged 61% since 1979, the post-GFC period has seen it almost double to 113%.
Both economic and policy factors have been offered as explanations for the source of the large valuation spread.
Economic Factors
Innovation and Technology: The US has a strong culture of innovation and entrepreneurship, fostering a vibrant startup ecosystem. This leads to higher levels of research and development (R&D) investment, driving technological advancements and productivity growth.
Flexible Labor Markets: US labor markets are generally more flexible than those in Europe, allowing for easier hiring and firing, which can help businesses adapt to changing economic conditions. The reason more capital doesn’t flow towards high-leverage ideas in Europe is because the price of failure is too high. Coste estimates that, for a large enterprise, doing a significant restructuring in the US costs a company roughly two to four months of pay per worker. In France, that cost averages around 24 months of pay. In Germany, 30 months.
Higher Productivity: US workers tend to be more productive than their European counterparts, partly due to factors like technology adoption, education levels, and work practices.
Strong Consumer Spending: US consumers have a higher propensity to consume, which drives economic growth through increased demand for goods and services.
Policy Factors
Favorable Regulatory Environment: The US generally has a more business-friendly regulatory environment, with fewer bureaucratic hurdles and less stringent regulations compared to some European countries.
Lower Corporate Taxes: Lower corporate tax rates in the US can incentivize businesses to invest and expand, boosting economic activity.
Strong Intellectual Property Protection: Robust intellectual property rights encourage innovation and investment by protecting the value of new ideas and inventions.
Open Markets and Trade: The US has a more open economy, with lower trade barriers and a greater emphasis on free trade, which can stimulate economic growth through increased exports and imports.
Dan Rasmussen of Verdad applied empirical tests to try to determine the sources of the valuation premium. He began by regressing valuation against other common risk factors for the top 1,000 stocks globally. He considered major style factors (size, quality, profitability, and investment) and sectors, and then added a binary variable for whether the company was listed on US markets. He also added a variable measuring the percentage of revenue derived from the US. This regression produced a 37% adjusted R-Squared in explaining valuations, which is quite high for explaining variation across individual equities.
The regression helped to show how differences in these style factors can explain differences in valuations. For example, companies that were growing faster tended to be more expensive (t-stat of 4.5), and companies that were higher quality tended to be more expensive (t-stat of 9.5).
The table below shows how the weighted-average factor exposures impacted valuation for US versus international equities.
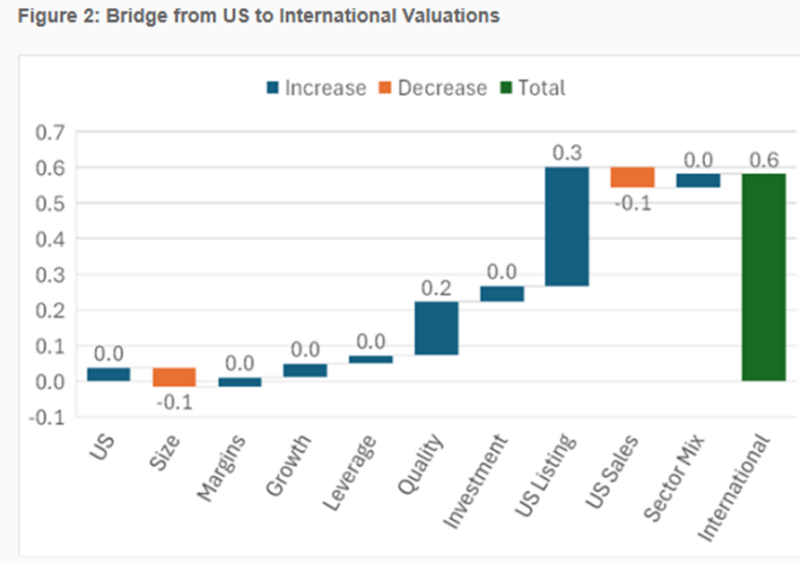
As you can see, US companies had more exposure to the quality factor (measured by gross profit and free cash flow divided by total assets). This difference drove about one-quarter of the valuation difference. Most of the other factors showed no or only slight differences in exposures to the common factors (for example, foreign stocks were somewhat smaller, profit margins were the same, as were growth exposures with growth being a blend of blend of revenue growth, profit growth and asset growth). What is surprising is the one factor that should not be expected to influence valuation had the largest impact—whether the stock was listed on a US exchange. The listing domicile explained about 50% of the valuation gap. In other words, US-listed stocks are substantially more expensive than internationally listed stocks for no reason other than the place of listing.
Another conundrum was that the percentage of US sales had a slightly negative impact on valuations! Rasmussen noted:
“A key driver of this is that several of the US tech giants most responsible for high US equity valuations having a relatively low percentage of sales in the US (Alphabet, Microsoft, and Tesla at around 50%; Apple, Netflix, Meta, and NVIDIA at around 40%). The big question, then, is why half the valuation gap is explained simply by being listed on US exchanges. Even large internationally listed companies with more than 40% of their revenue coming from the US, like Toyota, Mitsubishi, Roche or Deutsche Telekom (which owns T-Mobile), trade at steep value multiples relative to US peers.”
Investor Takeaways
Rasmussen showed that a large percentage of the valuation gap cannot be explained by fundamentals. If it were explained by fundamentals, we might expect the gap to persist. However, since much of the valuation gap is explained by the location of listing, it seems more likely that we should expect convergence in valuation. If that were to occur it would favor international over US-listed stocks. Investors should also consider the possibility that other developed countries could recognize that their social and economic policies have hindered their growth rates relative to that of the US and adopt more pro-growth policies. That too could lead to a narrowing of the valuation gap.
The takeaway for investors is to avoid recency bias. Diversification of risk is always the prudent strategy. The global market cap is a good starting point for allocating US and international assets. For those investors willing to be contrarians, they might (using Cliff Asness’ words) “sin a little” by overweighting international assets with the expectation that valuations would converge.
Larry Swedroe is the author or co-author of 18 books on investing, including his latest Enrich Your Future.

About the Author: Larry Swedroe
—
Important Disclosures
For informational and educational purposes only and should not be construed as specific investment, accounting, legal, or tax advice. Certain information is deemed to be reliable, but its accuracy and completeness cannot be guaranteed. Third party information may become outdated or otherwise superseded without notice. Neither the Securities and Exchange Commission (SEC) nor any other federal or state agency has approved, determined the accuracy, or confirmed the adequacy of this article.
The views and opinions expressed herein are those of the author and do not necessarily reflect the views of Alpha Architect, its affiliates or its employees. Our full disclosures are available here. Definitions of common statistics used in our analysis are available here (towards the bottom).
Join thousands of other readers and subscribe to our blog.