Rankings of Published Pricing-earnings Ratios and Investor Attention
- Jordan Moore
- A version of the paper can be found here.
- Want a summary of academic papers with alpha? Check out our Academic Research Recap Category.
Abstract:
Active investors with limited attention and capital constraints use fundamental metrics to screen and sort potential investments. Price-earnings (P/E) ratios are extremely popular, and are typically calculated using four trailing quarters of net income. Changes in the rankings of published P/E ratios may influence investor attention and subsequent excess returns. From 1974-2013, decile long-short portfolios formed on characteristics of P/E rankings which are rebalanced monthly earn value-weighted monthly excess returns of 101 basis points with annual Sharpe ratios of 0.79. Decile long-short portfolios which are rebalanced daily earn value-weighted daily excess returns of 16.99 basis points with annual Sharpe ratios of 2.91. Excess returns are robust to size, value, profitability, investment, price momentum, earnings momentum, short-term reversals, and relative volume. Changes to a stock’s P/E ranking predicts excess returns even when the stock’s P/E ratio itself does not change. The return premium cannot be explained by fundamental risk, clustering of attention at round number P/E ratios, or autocorrelation in the regressors.
Alpha Highlight:
Early in 1977, Basu finds that low P/E ratio portfolio earn higher returns than a high P/E portfolio. Nowadays P/E ratio is widely used to predict stock returns. However, Moore (2015) hypothesis that “P/E ratios predict stock returns, not because they proxy for value or profitability very well, but because they influence investor attention.”
In other words, short-term changes in a stock’s P/E ranking will influence investor attention and thus affect stock subsequent returns. Moore believes that even if the P/E ratio itself does not change, stocks can still earn a premium when their P/E ranking changes.
Thus, he constructs a “P/E attention Strategy” that long-short portfolios based on recent changes in P/E rankings, and proves that such strategy earns significant, positive and robust alphas!
P/E attention Strategy:
- Step 1: Calculate trailing E/P ratio for each stock-month using net income from the 4 most recent quarters.
- The formula for 4QEP is below: The numerator is the sum of the four most recent values of quarterly net income (NIQ). The denominator is market capitalization, calculated using the most recent monthly split-adjusted closing prices (PRC) and the most recent quarterly shares outstanding (CSHOQ)
![]()
- Step 2: Use both levels and changes in 4QEP rankings to proxy for investor attention.
- The paper consider both “new” investors’ attention and “returning” investors’ attention.
- AttnNew is the 4QEP percentile for stock i at the end of month t;
- AttnReturning is the change in 4QEP percentile for stock i from the end of month t-3 to the end of month t.
- AttnTotal is the equal-weighted average of the above two.
- Step 3: Construct Long-short “P/E attention Strategy”.
- Long every stock in the highest decile of AttnTotal and short every stock in the lowest decile of AttnTotal.
- Step 4: Make Money.
Robust Alpha:
This long-short decile portfolio earns an average monthly excess return of 1.01% and an annual Sharpe ratio of 0.79! The paper does a lot of robustness tests and finds out the “alpha” for “P/E attention strategy” is robust after controlling for any of the fundamental factors (MKT, SMB, HML, RMW, CMA, UMD..)
Below figure shows that excess returns increase monotonically from lowest decile of AttnTotal to highest decile of AttnTotal.
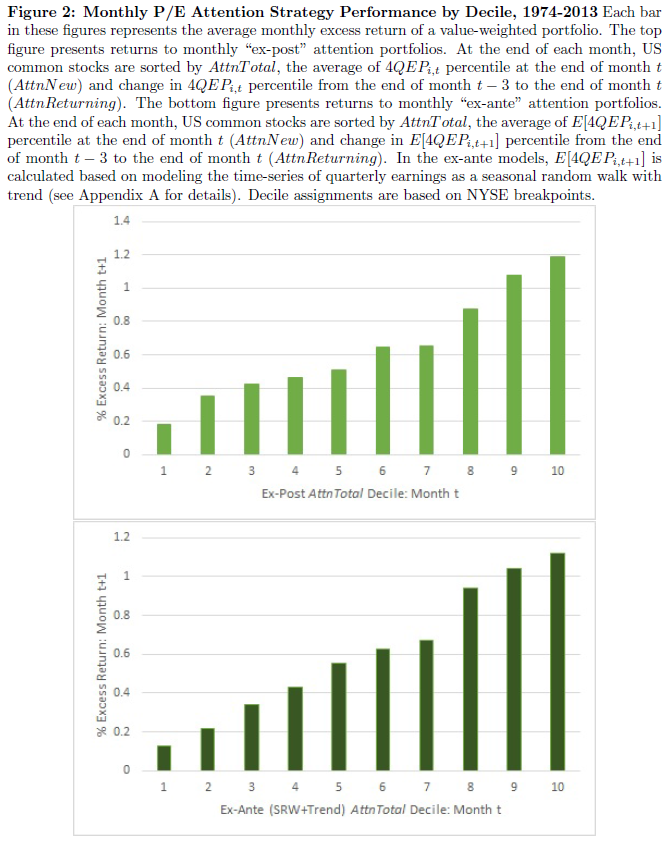
The alpha is the largest and most significant when re-balanced monthly, and becomes insignificant after 5 months.
An interesting paper!

About the Author: Wesley Gray, PhD
—
Important Disclosures
For informational and educational purposes only and should not be construed as specific investment, accounting, legal, or tax advice. Certain information is deemed to be reliable, but its accuracy and completeness cannot be guaranteed. Third party information may become outdated or otherwise superseded without notice. Neither the Securities and Exchange Commission (SEC) nor any other federal or state agency has approved, determined the accuracy, or confirmed the adequacy of this article.
The views and opinions expressed herein are those of the author and do not necessarily reflect the views of Alpha Architect, its affiliates or its employees. Our full disclosures are available here. Definitions of common statistics used in our analysis are available here (towards the bottom).
Join thousands of other readers and subscribe to our blog.