When Short Sellers and Corporate Insiders Agree on Stock Pricing
- Chune Young Chung, Hong Kee Sul, and Kainan Wang
- Journal of Portfolio Management
- A version of this paper can be found here
- Want to read our summaries of academic finance papers? Check out our Academic Research Insight category
What are the research questions?
This study uses a long and comprehensive time series covering 1977-2014, with just under 180,000 quarterly observations for trades of short sellers and demand for shares by corporate insiders. (see here for a related paper we covered recently that talks about informational advantages). The data is used to construct practical trading strategies utilizing in combination, the informational advantages contained in the volume of short selling and trading by insiders.
- Can profitable strategies be formed using the trades of short sellers and/or corporate insiders?
- Is a strategy that incorporates the direction AND magnitude of short seller trades and insider trades profitable?
- What are the drivers of the success of this strategy?
What are the Academic Insights?
- YES. In general, the long/short portfolio based on insider trading (3.01% market adjusted; 1.42% factor adjusted) earned larger and more significant excess returns than that portfolio using short interest trades (.82% market adjusted; .53% factor adjusted). It appears that both provide an informational advantage but following trades of insiders is more profitable than following trades of short sellers. Using both signals, the strategy produced returns of 1.27% in the subsequent month, 1.44% in the subsequent quarter and 2.03% in the subsequent year, appearing to tail off beyond the first quarter.
- YES. The authors report stronger performance when the magnitude of trading on both measures are included in the signal. With magnitude, excess returns were 3.96% (Exhibit 3 below) versus 2.03% excess without the magnitude of trading included in the signal. Assuming one-way trading costs of 50bps and full rebalancing, where all existing positions are closed out and new positions initiated, the strategy would produce 4.04%, net of the 6.04% market-adjusted returns annually.
- The authors perform sensitivity analysis and find that the strategy performs poorly under several conditions: (1) when the stock exhibits low levels of information asymmetry, measured by dispersion of analyst forecasts; (2) during market downturns; and (3) significant residual volatility at the stock level.
Why does it matter?
This research contributes to the literature in that it documents the drivers of success for trading strategies based on informational advantages of short seller and corporate insiders combined. Further, the authors are able to described when the strategy is unlikely to perform. The authors hypothesize underperformance may occur under 2 conditions: (1) During periods when investors and insiders have comparatively similar information or, (2) during periods of significant market uncertainty where short sellers and insiders have reduced credibility. Most of the evidence they put forth supports the former explanation.
The most important chart from the paper
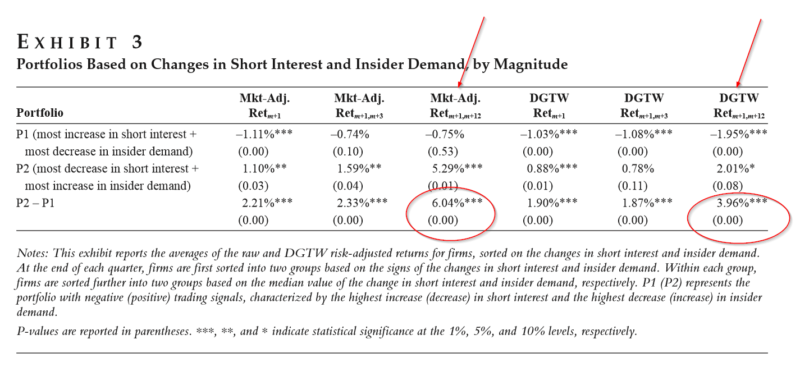
Note: The DGTW return is the average of each stock’s raw return minus the stock’s characteristic-based benchmark return within the portfolio.
Abstract
The authors propose a strategy that uses trading information of both short sellers and corporate insiders. They find that the strategy earns statistically significant and economically meaningful risk-adjusted returns for at least one year, stemming mainly from the information asymmetry between informed and uninformed investors. Based on this finding, they then show that the strategy works best in high-information-asymmetry environments and during economic expansion periods. The results have important implications for investment practitioners. Investors interested in high-information-asymmetry firms can refer to the information on short interest and insider demand when making investment decisions.

About the Author: Tommi Johnsen, PhD
—
Important Disclosures
For informational and educational purposes only and should not be construed as specific investment, accounting, legal, or tax advice. Certain information is deemed to be reliable, but its accuracy and completeness cannot be guaranteed. Third party information may become outdated or otherwise superseded without notice. Neither the Securities and Exchange Commission (SEC) nor any other federal or state agency has approved, determined the accuracy, or confirmed the adequacy of this article.
The views and opinions expressed herein are those of the author and do not necessarily reflect the views of Alpha Architect, its affiliates or its employees. Our full disclosures are available here. Definitions of common statistics used in our analysis are available here (towards the bottom).
Join thousands of other readers and subscribe to our blog.