Conventional wisdom can be defined as ideas that are so ingrained in our belief system that they go unchallenged. Unfortunately, much of the “conventional wisdom” about investing is wrong. One example of erroneous conventional wisdom is that investors seeking higher returns should invest in countries that are forecasted to have high rates of economic growth, such as India and China.
It certainly seems intuitively logical that if you could accurately forecast which countries would have high rates of economic growth you would be able to exploit that knowledge and earn abnormal returns.
Unfortunately, relying on intuition often leads to incorrect conclusions. In this case, it fails to account for the fact that markets are highly efficient in building information about expectations into current prices. Another problem is that many investors fail to understand the difference between information and value-relevant information (information that is not already reflected in valuations). The empirical research (about expected returns, equity returns, and economic growth) that discusses the correlation between country economic growth rates and stock returns has found that there has been no significant relationship between short-term economic growth rates and stock returns.
We see the same results when looking at the returns to growth and value stocks. Even though growth companies (those with higher P/E, P/B, P/CF, etc., ratios) have produced faster growth in earnings and higher returns on assets and equity, they have produced lower returns. The logical explanation is that the market has already built into prices the higher future expectations. The risk-based explanation is that value companies are perceived to be riskier and thus their future earnings are discounted at a higher rate, resulting in higher returns. The behavioral explanation is that the market tends to overestimate the persistence of abnormal growth in earnings (both positive for growth stocks and negative for value stocks). When the reversion to the mean of those abnormal earnings occurs, the result is higher returns to value stocks. Both explanations are supported by empirical research.
The lack of correlation between growth and returns stands in sharp contrast with the empirical evidence (about stock prices, predicting market returns, and P-CAPE) demonstrating that there is a strong correlation between valuations and future returns, with the CAPE 10 (the Shiller Cyclically Adjusted P/E ratio) being as strong a predictor of returns over the next decade as we have.
US Exceptionalism
The major narrative of the 17-year period 2008-2024 has been that US stocks have far outperformed international stocks: The S&P 500 Index returned 10.7% per annum, the MSCI EAFE Index 3.3% per annum, and the MSCI Emerging Markets Index 1.9% per annum. The outperformance has been attributed to US exceptionalism fueled by: A stronger culture of innovation and entrepreneurship; more flexible labor markets; higher productivity; stronger consumer consumption driving demand for goods and services; a more favorable regulatory environment; lower corporate taxes; stronger intellectual property rights; and more open markets and trade policy.
The research team at Verdad examined how the US equity outperformance has impacted valuations and exposures to common factors. The following is a summary of their key findings:
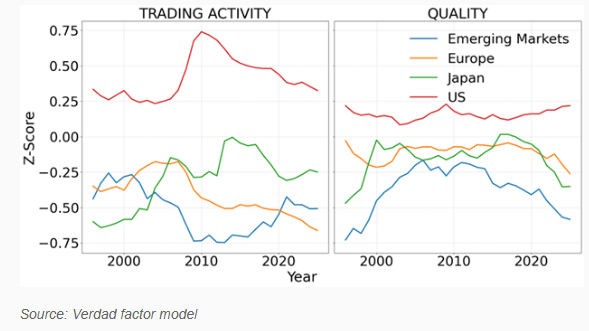
The US equity market stands out as now comprising larger, higher quality, more expensive, and more liquid stocks (higher trading volume). The table below shows equity trading activity on the left and quality (as measured by gross profit to assets and free cash flow to assets) on the right.
Figure 1: Comparison of Trading Activity & Quality Factor Exposures (1996-2025)
The results are hypothetical results and are NOT an indicator of future results and do NOT represent returns that any investor actually attained. Indexes are unmanaged and do not reflect management or trading fees, and one cannot invest directly in an index.
Japanese equity valuations have become cheaper (see table 2 below) while leverage has been significantly reduced (see table 2 below) reducing risk.
Figure 2: Comparison of Value & Leverage Factor Exposures (1996-2025)
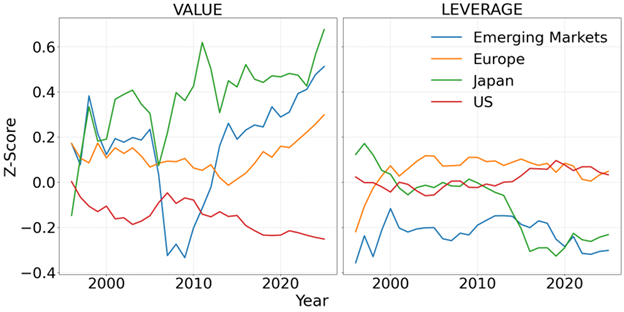
Source: Verdad factor model
The results are hypothetical results and are NOT an indicator of future results and do NOT represent returns that any investor actually attained. Indexes are unmanaged and do not reflect management or trading fees, and one cannot invest directly in an index.
Figure 3: Comparison of Growth & Investment Factor Exposures (1996-2025)
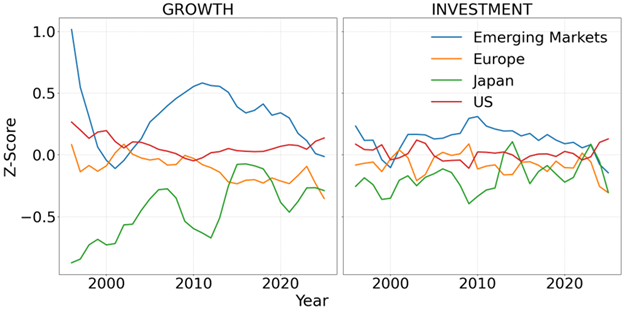
Source: Verdad factor model
The results are hypothetical results and are NOT an indicator of future results and do NOT represent returns that any investor actually attained. Indexes are unmanaged and do not reflect management or trading fees, and one cannot invest directly in an index.
Verdad observed:
“Japan’s historically conservative approach to leverage, shaped by the fallout of the late 1990s bubble, is evident in the right panel of Figure 2. Leverage ratios have steadily declined as companies prioritized cash reserves over debt. While this has contributed to financial stability, it has also weighed on capital efficiency, making the recent TSE (Tokyo Stock Exchange)-enforced governance reforms to reduce excessive cash reserves a pivotal step, in our opinion, toward enhancing shareholder value.”
- EM equities have sustained a sharp decline in profitability (quality, as shown in table 1 above). However, reflecting that decline, valuations have declined (see table 2 above)—value exposure has increased as they have become cheaper.
- The average factor exposures for European equities have been mostly stable.
- Ex-US dividend yields have been rising as valuations have become cheaper.
Figure 4: Comparison of Dividend Yield Factor Exposures (1996-2025)
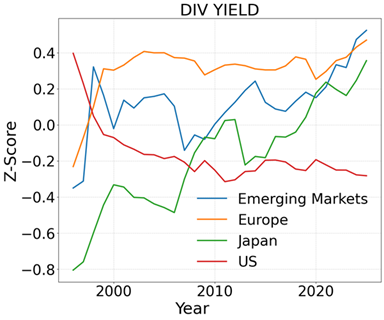
The results are hypothetical results and are NOT an indicator of future results and do NOT represent returns that any investor actually attained. Indexes are unmanaged and do not reflect management or trading fees, and one cannot invest directly in an index.
Investor Takeaways
The first takeaway should be that the lack of a relationship between GDP growth and stock returns is in stark contrast to the strong positive correlation between valuation measures (such as the CAPE 10) and real stock returns. The conclusion we can draw is that stock returns are predominantly driven by valuations, not economic growth. Investors price future growth expectations and reflect them in current valuations, no matter whether one examines large, medium or small enterprises.
In terms of valuations, we can make the following observations:
- US exceptionalism appears to be already built into valuations. Thus, investors should not expect a repeat of the last 17 years since a majority of the outperformance resulted from increased valuations (which are not likely to be repeated and could revert to their longer-term mean).
- Despite Japan becoming more shareholder friendly, with declining leverage and increasing dividend yields, their stocks have continued to get cheaper and cheaper.
- Emerging markets experienced a boom-bust cycle in growth and investment, with the market now cheap, but also lower quality.
- Europe has gotten cheaper (see table 1 above) and has high dividend yields—yet it attracts little trading activity and interest from investors.
Summarizing, it is important to note that factor exposures can change dramatically over time as economic and market regimes change. US exceptionalism provided the same explanation for the outperformance of US stocks in the 1990s. However, that regime changed. From 2000-2007, while the S&P 500 Index returned just 1.9% per annum (underperforming riskless one-month Treasury bills by 1.3% per annum), the MSCI EAFE Index returned 5.6% per annum, and the MSCI Emerging Markets Index returned 15.3% per annum.
Words of Caution
While economic theory and empirical evidence suggest that the most prudent strategy is to diversify globally, it must be acknowledged that for many investors, diversification can be hard because a globally diversified portfolio will inevitably go through long periods of poor performance. Sadly, when it comes to judging performance, it is my experience that most investors believe that three years is a long time, five years is a very long time, and 10 years is an eternity. Yet, financial economists know that events that take place over 10 years are very likely to be nothing more than noise that should be ignored. Otherwise, instead of following a disciplined rebalancing strategy of buying low (i.e., the recent underperformers) and selling high (the recent outperformers), investors chasing recent trends tend to do the opposite, buying high and selling low. Smart investors know that if they are well diversified, they will almost always have positions that have underperformed. To obtain the benefits of diversification you must be willing to accept that reality and have the discipline to stay the course.
The evidence has demonstrated that although the benefits of a global equity allocation may have been reduced by market integration, they have not disappeared. While global diversification can disappoint over the short term (as has been the case for those who have diversified away from U.S. stocks in the last 17 years), over longer time periods it is still the free lunch that economic theory and common sense imply.
Before making the mistake of confusing the familiar with the safe, no one knows which country or countries will experience the next prolonged period of underperformance. That uncertainty is what international diversification protects against, making it the prudent strategy.
Larry Swedroe is the author or co-author of 18 books on investing, including his latest Enrich Your Future.

About the Author: Larry Swedroe
—
Important Disclosures
For informational and educational purposes only and should not be construed as specific investment, accounting, legal, or tax advice. Certain information is deemed to be reliable, but its accuracy and completeness cannot be guaranteed. Third party information may become outdated or otherwise superseded without notice. Neither the Securities and Exchange Commission (SEC) nor any other federal or state agency has approved, determined the accuracy, or confirmed the adequacy of this article.
The views and opinions expressed herein are those of the author and do not necessarily reflect the views of Alpha Architect, its affiliates or its employees. Our full disclosures are available here. Definitions of common statistics used in our analysis are available here (towards the bottom).
Join thousands of other readers and subscribe to our blog.