Everyone makes mistakes. It’s part of what makes us human. Because humans understand their actions are sometimes flawed, it was perhaps inevitable that the field of psychology would develop a rich body of academic literature to analyze why it is that human beings often make poor decisions. In this blog we talk about behavioral investing and the role that bias plays in investment decision making.
Behavioral investing and the “experts”
Although insights from academia can be highly theoretical, our everyday life experiences corroborate many of these findings at a basic level: “I know I shouldn’t eat the McDonalds Big Mac, but it tastes so good.” Because we recognize our frequent irrational urges, we often seek the judgment of experts, to avoid becoming our own worst enemy.
How does this apply to behavioral investing? We assume that experts, with years of experience in their particular fields, are better equipped and incentivized to make unbiased decisions. But is this assumption valid? A surprisingly robust, but neglected branch of academic literature, has studied, for more than 60 years, the assumption that experts make unbiased decisions. The evidence tells a decidedly one-sided story: systematic decision-making, through the use of simple quantitative models with limited inputs, outperforms discretionary decisions made by experts. This essay summarizes research related to the “models versus experts” debate and highlights its application in the context of investment decision-making. Based on the evidence, investors should de-emphasize their reliance on discretionary experts, and should instead approach investment decisions with systematic models.
To quote Paul Meehl, an eminent scholar in the field:
“There is no controversy in social science that shows such a large body of qualitatively diverse studies coming out so uniformly in the same direction as this one [models outperform experts].”1,2
Section 1: Introduction
“If you do fundamental trading, one morning you feel like a genius, the next day you feel like an idiot…by 1998 I decided we would go 100% models…we slavishly follow the model. You do whatever it [the model] says no matter how smart or dumb you think it is. And that turned out to be a wonderful business.”
–Jim Simons, Founder, Renaissance Technologies3
I should probably admit something upfront: I once believed I was going be the next Warren Buffett. As a child, I raised animals and sold them at the county fair to make money.

And with my growing savings came decisions—what to do with the money?
To jumpstart my learning, my Grandmother gave me a copy of Benjamin Graham’s The Intelligent Investor, which describes the philosophy of value investing. I was 12 at the time and instead of being overwhelmingly appreciative, I was secretly depressed I didn’t get a Nintendo. Nonetheless, I read the book and loved it. I was hooked on value-investing. Over the next 10 years, I devoured books on value investing and eventually put my hard-earned “skills” to work, investing in value stocks and special situations.
Part of my investing education included matriculating in the finance Ph.D. program at the University of Chicago. The first two years of the program were similar to drinking from a high-powered fire hose, which spewed sometimes unintelligible information and math equations from the leading scholars in finance. It was not always the most enjoyable experience. However, I persevered and met Professor Nick Barberis4, who was researching the intersection between financial economics and psychology, a growing field that has since come to be known as “Behavioral Finance.” I took Professor Barberis’ Ph.D. seminar and read over 100 academic papers on behavioral finance. Although I wasn’t sure how I could apply my new knowledge, I recognized that psychology was a powerful force in understanding financial economics.
Simultaneous with my exposure to behavioral investing, I was managing a small amount of money I had raised from my family and friends. I soon realized that the “irrational, emotionally involved, overconfident traders” Professor Barberis was referring to in his course weren’t just theoretical investors dreamed up in the ivory tower—this crazy investor was me! I realized that no matter how many times I foolishly told myself that I was as smart as Warren Buffett, I would never actually be Buffett. I would always succumb to my innate cognitive biases. I guess sometimes it takes getting a Ph.D. to realize you really don’t know it all.
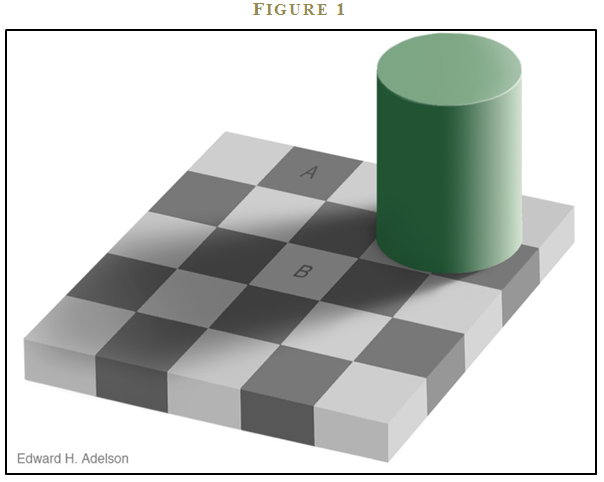
I also understood that I am not the only one capable of illogical thought—we all can succumb to bias. Figure 1 highlights this point5. Stare at box A and box B in the figure. If you are a human being you will identify that box A is darker than box B.
Then ask yourself:
“How much would I bet that A is darker than B?” $5? $20? $100?”
We know how a human approaches this question, but how does a computer think about this question? A computer identifies the red-green-blue (RGB) values for a pixel in box A and the RGB values for a pixel in B. Next, the computer tabulates the results: 120-120-120 for box A; 120-120-120 for box B. Finally, the computer compares the RGB values of the pixel in A and the pixel in B, identifies a match, and concludes that box A and box B are the exact same color. The results are clear to the computer.
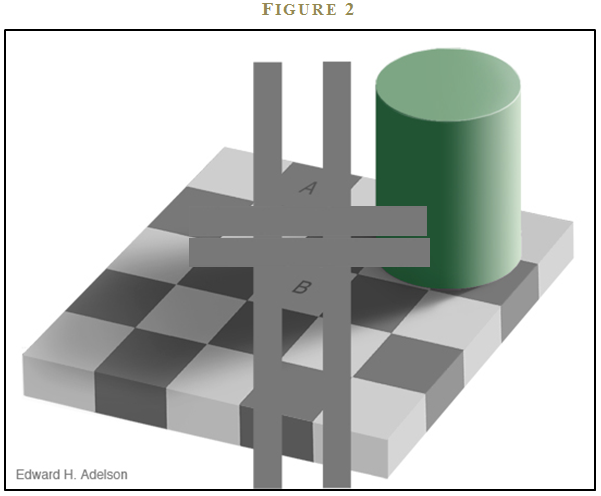
Now, after taking into consideration the results from the computer algorithm, would you still consider A darker than B? I don’t know about you, but I still think A looks darker than B—call me crazy. (See Figure 2). But then that’s what makes me human.
The sad reality is the computer is correct, and our perception is wrong. Our mind is being fooled by an illusion created by a vision scientist at MIT, Professor Ed Adelson. Dr. Adelson exploits local contrast between neighboring checkers, and the mind’s perception of the pillar casting a shadow. The combination creates a powerful illusion that tricks every human mind. The human mind is, as succinctly stated by Duke psychology professor Dan Ariely, “Predictably irrational.”
That may seem to be a strong statement. Perhaps the illusion above has convinced you that our minds may not be perfect in certain isolated settings. Or perhaps it has only persuaded you to believe that while a subset of the population may be flawed, you still possess a perfectly rational and logical mind. Don’t be too sure, as a well-established body of academic literature in psychology demonstrates conclusively that humans are prone to poor decision-making across a broad range of situations. This is important to understand as we contemplate behavioral investing.
But are experts beyond the grip of cognitive bias? We often assume that professionals with years of experience and expertise in a particular field are better equipped and incentivized to make unbiased decisions. Unfortunately for experts, the academic evidence is emphatic: systematic decision-making, or models, outperform discretionary decision-making, or experts.
Section 2: Are experts prone to Behavioral Investing Pitfalls?
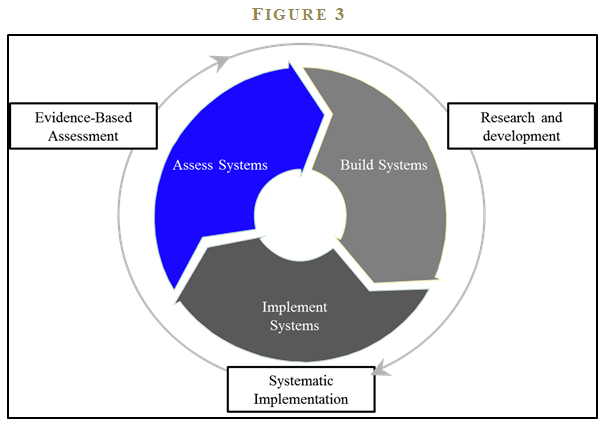
To be clear: I am not making the claim that human experts are worthless in the decision-making process. Experts are critical, but only for certain aspects of the decision-making process. Students of decision-making break the decision-making process into three components (see Figure 3):
- Research and development
- Implementation
- Assessment
I would argue that human experts are required for the first and third phases of a decision-making process, which are the research and development phase and the assessment phase, respectively. The crux of my argument is that human experts should not be involved in the second phase of decision-making, or the implementation phase.
During the research and development phase of decision-making, we build and test new ideas. In this phase, experts are required to create a sensible model. In the second phase—implementation—we should eliminate human involvement and rely on systematic execution – to potentially avoid the pitfalls of behavioral investing. Finally, during the assessment phase of decision-making, we should once again rely on human experts to analyze and assess model performance to make improvements and incorporate lessons learned from the implementation phase.6
I look to the real world for insights into how this three-phase decision-making framework might be applied in practice. A great case study exists within the US Marine Corps, where I spent nearly four years as an officer deployed in a variety of combat situations. The USMC relies on “standard operating procedures,” or SOPs, particularly when it places its Marines in harm’s way. SOPs are developed according to the three-step process mentioned above, which is designed to establish the most robust, effective, and systematic decision-making process possible. One example is the SOP for setting up a defensive position in a combat situation. 7 In the first phase of SOP development, experienced combat veterans and expert consultants review past data and lessons from the field to develop a set of rules that Marines will follow when establishing a defensive position. These rules are debated and agreed upon in an environment that emphasizes slow, deliberate, and critical thought. The current rules, or SOP, for a defensive position’s priority of work is summarized by the acronym SAFE:
- Security
- Automatic Weapons on Avenues of Approach
- Fields of Fire
- Entrenchment.
During the second phase—the implementation phase—of SAFE, Marines in combat are directed to “follow the model,” or adhere to the SOP. The last thing a Marine should do is disregard SOPs in the middle of a fire-fight when the environment is chaotic and human decisions are most prone to error.
Marines are trained from the beginning to avoid “comfort-based” decisions and to follow standard operating procedures. Of course, once the battle is over, Marines in the field will conduct a debrief and send this information back to the experts who can debate and assess in a calm environment whether the current SOP needs to be changed based on empirical experience gleaned from the field—the third phase. A key principle of this 3-step decision-making process is that discretionary experts are required to develop and assess, but the execution phase is made systematic, so as to minimize human error. The Marines, like other critical decision-makers, want experts to develop and assess SOPs in a stable environment. However, the Marines want to implement SOPs systematically when the environment shifts from the war-gaming room to the live battlefield.
Section 3: The Expert Hypothesis
The so-called “expert’s hypothesis,” which asserts that experts can outperform models, is intuitive and tells a deceptively compelling story. For example, to most, it seems like common sense that a hedge fund manager with a Harvard MBA and 20 years of work experience at Goldman Sachs can beat a simple model that buys a basket of low P/E stocks. The logic behind this presumption is persuasive, as the expert would seem to possess a number of advantages over the model. The expert can arguably outperform the simple model for the following reasons:
- Experts have access to qualitative information.
- Experts have more data.
- Experts have intuition and experience.
Of course, there are other ways to support the argument that a human expert will beat a simple model, but most of these stories revolve around the same key points outlined above. Three specious arguments underlie the expert’s hypothesis:
- Qualitative information increases forecast accuracy.
- More information increases forecast accuracy.
- Experience and intuition enhance forecast accuracy.
Remarkably, the evidence I will present illustrates that soft information, more information, and experience/intuition do not lead to more accurate or reliable forecasts, but instead lead to poor decision-making. And because this result is so counterintuitive, it makes it that much more important to understand.
Among the hundreds of cases of expert forecasts gone awry, one high-profile example is Meredith Whitney.8 Ms. Whitney is famous for her prescient forecast of the banking crisis that reared its ugly head in late 2008. Public accounts of Ms. Whitney’s predictions, widely observed and discussed during that time period, all suggested that Ms. Whitney was a “genius” after her remarkable call on Citibank’s balance sheet blues.
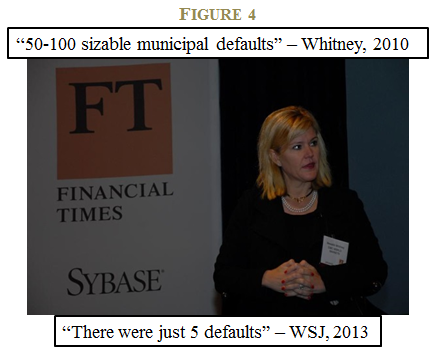
But Ms. Whitney didn’t stop there. She outlined her gloomy forecast for the municipal bond market on a December 2010 segment of the prime-time CBS news program, 60 Minutes. Ms. Whitney predicted there would be “50 to 100 sizable defaults.” She forcefully reiterated her prediction at the Spring 2012 Grant’s Interest Rate Observer Conference, where we observed firsthand the emotional conviction Ms. Whitney felt for her bold prediction.
However, Ms. Whitney’s powers of prediction were fleeting. In an article published in September 2012, the Wall Street Journal published a stinging article entitled, “Meredith Whitney Blew a Call—And then Some.” The piece was quick to point out that “there were just 5 defaults” in the municipal market. (See Figure 4).9
Ms. Whitney was off by a factor of 10.
Whitney’s missed call embodies the assumptions underlying the expert hypothesis. She was a well-known expert with access to the best qualitative and quantitative data available. That, coupled with her well-known previous experience and astute intuition, made her story compelling to the media and other experts alike.
Many believed that Whitney had to be right. Whitney, like everyone else, also thought she had to be right. She had access to important people in local and state governments who provided her with privileged “soft” information; she studied thousands of pages of municipal bond term-sheets and macroeconomic research reports, and her recent experience making the call on the Financial Crisis crystallized in her own mind that she could trust her “gut.”
Here’s where behavioral investing can rear its ugly head. Unfortunately, the potent combination of realized success and intense effort gives human experts the “illusion of skill,”10 which translates into overconfidence and a failure to appreciate randomness. Mark Twain’s quip summarizes the problem: “It ain’t what you don’t know that gets you into trouble. It’s what you know for sure that just ain’t so.” In other words, our highest conviction decisions are apt to cause us the most problems.
Section 4: The Evidence on Models Versus Experts11
To substantiate the argument that the expert hypothesis is false, I stand on the shoulders of academic researchers who have studied this hypothesis for over half a century.
To give readers a flavor for how academic research has studied the relative performance of models versus experts, I introduce a study on parole recidivism predictions.12 The study was facilitated by a partnership between a group of academic researchers and the Pennsylvania Board of Probation and Parole to identify ways to make the parole process more accurate, fair, and cost-effective. Professor Carroll and his team set up the experiment as follows:
- Experts: Collect information to make parole board decisions based on quantitative and qualitative information used in the decision-making process. This included interviews with the parolees, interviews with people known by the parolee, information on past criminal history, demographics, and so forth.
- Models: Create a simple predictive model of parolee recidivism based on predictive factors. The baseline model consists of three elements: offense type; the number of past convictions; and the number of prison rule violations.
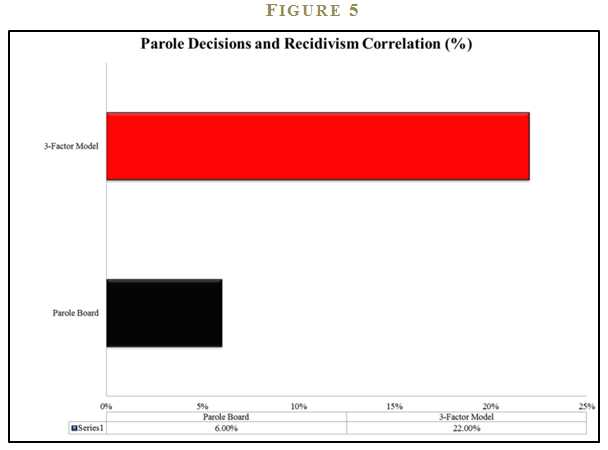
The researchers compare the performance of the experts against simple models in out-of-sample tests. The summary finding is that a simple model, while far from perfect, is over three times more effective than experts at forecasting recidivism (See Figure 5).
The research results were not lost on practitioners in the real world. A 2013 Wall Street Journal article, “State Parole Boards Use Software to Decide Which Inmates to Release,” highlights how algorithmic parole decisions are now the norm, and no longer the exception.13
WHAT IF EXPERTS HAVE THE MODEL?
The evidence above suggests that models beat experts in the context of parole recidivism. Subsequent research came to similar conclusions across a variety of contexts pitting man versus machine. Perhaps more importantly, the research on models versus experts inspired scholars to tackle another question:
How do experts perform if they are given the results of the model?
D. Leli and S. Filskov explore this question in their 1984 study, “Clinical Detection of Intellectual Deterioration Associated with Brain Damage.”14 The study’s premise is simple. First, place experienced psychologists and a simple prediction algorithm head-to-head in a horse race. Next, see who can more accurately classify the extent of a patient’s brain impairment, based on W-B protocol statistics. 15 The model utilizes a systematic approach based on a statistical model of prior data; meanwhile, humans can utilize their vast experience and intuition based on years of experience.
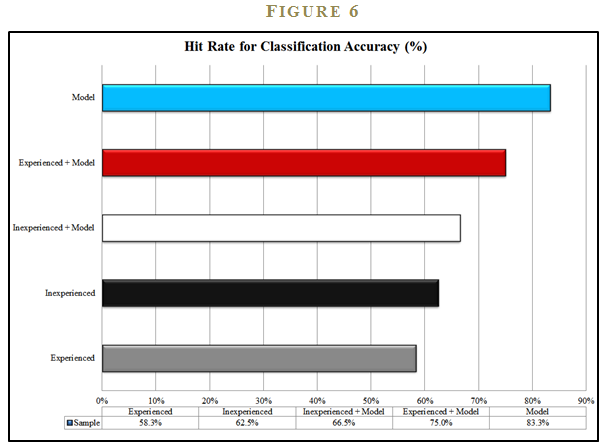
The results of the study are striking. The simple quantitative model has a classification accuracy ratio of 83.3%, much higher than the experienced clinicians, who had a success rate of only 58.3%. Interestingly, the inexperienced clinicians were slightly better at 62.5%. The model (and the novices) clearly beat the experts.
But the researchers took their analysis one step further. They wanted to explore what would happen when the experts were armed with the powerful prediction model. A natural hypothesis is that experts, equipped with the model, would outperform the stand-alone model. In other words, models might represent a floor on performance, to which the experts could add performance.
In follow-on tests, the researchers gave the experts the output of the model and disclosed that the model has “previously demonstrated high predictive validity in identifying the presence or absence of intellectual deterioration associated with brain damage.” Using the model, experienced clinicians significantly improved their accuracy ratio from 58.3% to 75% and the inexperienced clinicians moved from 62.5% to 66.5%. Nonetheless, the experts were still unable to outperform the stand-alone model, which had already established the gold standard 83.3% success rate. This study suggests that models don’t represent a floor on performance; rather, models reflect a ceiling on performance, from which the experts detract. The “secret sauce” of human judgment ruins the beautiful simplicity of a calculation (See Figure 6).
BUT QUANTAMENTAL IS DIFFERENT, RIGHT?
Let’s think about how these insights apply to the world of behavioral investing. Investors consider themselves to be unique, in the sense that there is a belief that a human expert armed with a model can generate outsized returns in financial markets, or in other words, financial models represent a floor on performance, not a ceiling. Carson Boneck, Global Head of Investment Management for S&P Capital IQ, stated the following in May 2013:
“We think quantamental is going to be a big theme driving our client portfolios and our own product strategy.”16
Mr. Boneck tells a great story: A discretionary stock-picking expert armed with a powerful model may create a powerful combination. But investment clients should ask if there is any evidence that a quantamental approach—a process that involves the use of models to screen for promising stocks, but overlays a human element to make the final investment decision—actually adds value. One might argue that the experts in the Leli and Filskov (1984) study were sub-par and perhaps the study design was flawed. Or perhaps these results are only relevant to the field of brain research. Expert stock pickers with years of experience in the investment management business, by contrast, may have access to superior fundamental research tools and can develop a more pronounced qualitative information edge. Stock pickers can’t possibly be beaten by simple models, can they? As it turns out, we have a reasonable real-world laboratory that provides insight into this question.
Joel Greenblatt, famous for his bestselling books You Can Be a Stock Market Genius and The Little Book that Beats the Market, stumbled into a natural experiment. Joel’s firm, Formula Investing, utilizes a simple algorithm that buys firms that rank high on an average of their cheapness and their quality ranking. The firm offers investors separately managed accounts (SMAs) and investors have a choice in how to invest:
- Invest using only the model’s output.
- Receive the model’s output, but use discretion to identify stocks held in the portfolio.
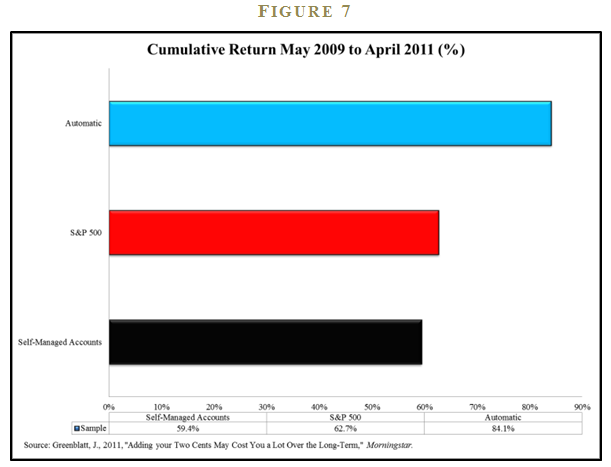
Joel collected data on all their SMAs from May 2009 through April 2011 and tabulated the results. He wanted to know if adding discretion to the investment process would improve results. (See Figure 7).
The automatic accounts earned a total return of 84.1%, besting the S&P 500 Index’s 62.7% mark by over twenty percentage points. The self-managed accounts, which allowed the clients to pick and choose from the model’s output at their discretion, earned a respectable 59.4%. However, the 59.4% figure was worse than the passive benchmark and much worse than the account performance for the automatic accounts. 17 This takeaway from this study is similar to the brain impairment research by Leli and Filskov: Models represent a ceiling on performance, not a floor.
A STUDY OF ALL THE STUDIES
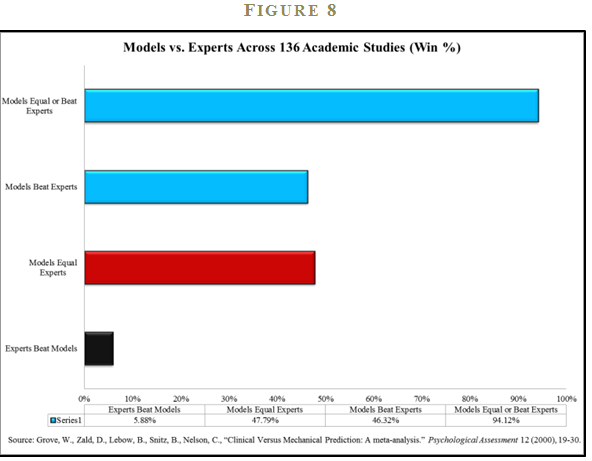
Thus far I’ve presented a few formal studies and an ad-hoc study of investor behavior in an attempt to clarify the role that behavioral investing may place in decision making. In order to make a more convincing case that models beat experts, I require more analysis. Luckily, one doesn’t have to look far for additional evidence. Professors William Grove, David Zald, Boyd Lebow, Beth Snitz, and Chad Nelson have performed a meta-analysis—or a study of studies—on 136 published studies that analyze the accuracy of “actuarial” (i.e., computers/models) vs. “clinical” (i.e., human experts) judgment.18
The studies examined by Grove et al. include forecast accuracy estimates that cut across many professions. The studies included examples from the following fields:
- College academic performance
- Magazine advertising sales
- Success in military training
- Diagnosis of appendicitis
- Business failure
- Suicide attempts
- University admissions
- Marital satisfaction
- Wine quality
The study’s results are stunning: Models beat experts 46% of the time; models equal or beat experts 94% of the time; and experts beat models a mere 6% of the time (See Figure 8). The empirical evidence that systematic decision processes meet or exceed discretionary decision making would seem to be overwhelming. The executive summary of the study says it best:
Superiority for mechanical-prediction techniques was consistent, regardless of the judgment task, type of judges, judges’ amounts of experience, or the types of data being combined.
–Grove et al.
The empirical evidence on the horse race between model-driven decisions and discretionary decision-making is clear, maybe even a slam dunk, but the implications are unsettling. How is it possible that a simple algorithm can consistently beat expert opinion? The answer to this conundrum lies with cognitive bias.
Section 5: Why Experts Fail to Beat Models
Daniel Kahneman’s magnum opus, Thinking, Fast and Slow19, describes a less-than-perfect view of human decision-making. The thesis of the book is that humans are driven by two modes of thinking: System 1 and System 2.
- System 1: Decisions are instinctual and heuristic-based.
- System 2: Processes are calculated and analytical.
System 1 thinking, while imperfect, is speedy and highly efficient. For example, if Joe is facing the threat of a large tiger charging him at full speed, his System 1 thinking will trigger Joe to turn around and sprint for the nearest tree, and ask questions later. As an alternative, Joe’s System 2 thinking will calculate the speed of the tiger’s approach and assess his situation. Joe will examine his options and realize that he has a loaded revolver that can take the tiger down in an instant. On average, if Joe immediately sprints to the tree he may get lucky and outrun the tiger; on the other hand, if Joe pauses and calculates his best option, which is blowing the tiger away with his revolver, Joe’s tactical pause may end with Joe trying to remove a 500-pound meat-eating monster from his jugular vein.
Joe’s hypothetical situation highlights why evolution has created System 1; on average, running for the tree is a life-saving decision when faced with a high-stress situation where survival is on the line. The issue with System 1 is that its heuristic-based mechanisms often lead to systematic bias: Joe will always run, even when the better decision may be to shoot.
System 1 certainly served its purpose when humans were faced with life and death situations in the jungles, but in modern-day life, where decisions in chaotic work environments may have limited physical consequences, the benefits of immediate decisions rarely outweigh the costs of flawed decision-making. For example, the necessity of avoiding System 1 and relying on System 2 in the context of financial markets is of utmost importance.
I highlight three core reasons why human experts making discretionary decisions underperform systematic decisions facilitated via simple models, with each discussed in more details.
1. Same facts; different decisions
Humans, unlike models, can take the same set of facts and arrive at different conclusions. This can happen for a variety of reasons, but a lack of human consistency is often attributed to anchoring bias, framing effects, availability bias, or something as simple as hunger and fatigue. A computer suffers from none of these ailments—same input, same output.
2. Story-based, not evidence-based decisions
Humans suffer from a proclivity to believe in stories or explanations that fit a fact pattern, but they don’t bother to fully consider the empirical evidence. For example, consider the following statement:
Linda is thirty-one years old, single, outspoken, and very bright. She majored in philosophy. As a student, she was deeply concerned with issues of discrimination and social justice, and also participated in antinuclear demonstrations.
Is it more likely that Linda is a bank teller or that Linda is a bank teller and is active in the feminist movement? Our gut instinct is to think that it is more likely that Linda is a feminist bank teller since the concepts of discrimination and social justice activate our stored memories that are traditionally associated with feminism. But this line of reasoning is incorrect, as it ignores the statistical reality. 20 System 1’s love for a coherent story has led us to make a poor judgment, which is divorced from the true underlying probabilities. An empirical-based decision would consider the fact that the bank teller population is much larger than the feminist bank teller population and immediately understand that it is statistically more likely that Linda is a bank teller. We have been led astray by our urge to create a story that in our gut seems to describe the evidence.
3. Overconfidence
Humans are consistently overconfident. Overconfidence can be driven by cognitive errors such as hindsight bias—believing past events were more predictable ex-ante than they actually were—and self-attribution bias—attributing good outcomes to skill and poor outcomes to bad luck. Systematic decisions limit these problems. Models don’t get emotionally involved and don’t have an ego. Therefore, they are unable to get overconfident or overoptimistic—they simply execute based on the facts.
Section 5A: Same Facts; Different Decisions
Anchoring
Stimuli from the environment attack human discretionary decisions at a subconscious level. Often we don’t even know we are vulnerable. One important example is anchoring. Broadly defined, anchoring describes our tendency to rely too heavily upon, or “anchor,” on irrelevant information when making decisions.
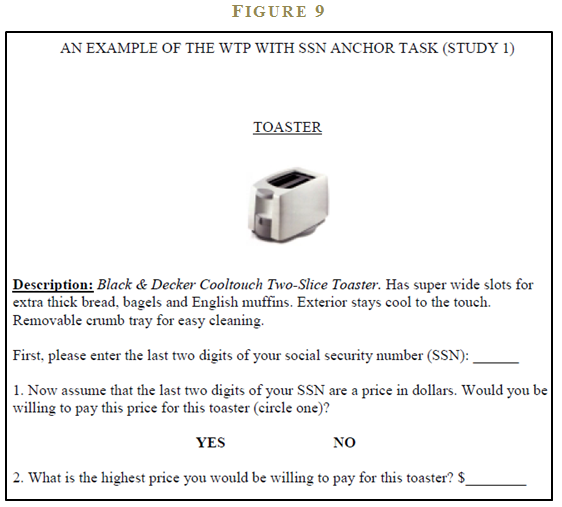
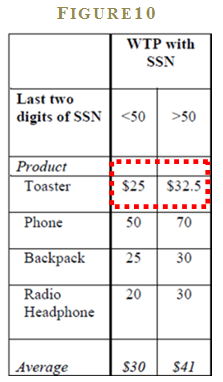
An example comes from research by Professors Simonson and Drolet who study how consumer behavior is affected by irrelevant anchors. The researchers ask buyers to assess their willingness to pay for a variety of products, including a Black & Decker Cooltouch Two-Slice Toaster. 21 The researchers played a trick on some of the buyers along the way. The selected buyers are asked to write down the last 2 digits of their social security number prior to asking the question about willingness to pay. The anchoring hypothesis predicts that buyers with higher SSN values will be willing to pay a higher amount and those with lower SSN will be willing to pay a lower amount.
Remarkably, the value for the last 2 digits of one’s social security number actually influences the buyer’s willingness to pay. Buyers with SSNs above 50 report a willingness to pay of $32.50, whereas, buyers with SSNs less than 50 report $25. Those who are not affected by the SSN anchor report $30. The researchers repeat this experiment on different consumer products such as phones, backpacks, and radio headphones and find similar results. The evidence from this study—and the many other studies like it—document that anchoring effects have a powerful influence on our decisions.
But how might anchoring affect a professional stock-picking portfolio manager? Imagine the manager is conducting a discounted cash flow analysis that requires a 10-year revenue growth forecast. There are two scenarios:
- The manager’s secretary walks in and mentions that his prior meeting with a new client has been moved to the 5th of January
- The secretary walks in and mentions that his prior meeting with a new client has been moved to the 30th of January.
The only difference in the two scenarios is the mention of “5th” and “30th.” Is the manager going to input the same revenue growth projection in both these scenarios? If Professor Kahneman’s description of the strength of the anchoring bias is true, it is likely he will enter a higher growth rate number in the “30th” scenario:
“[Anchoring is] one of the most reliable and robust results of experimental psychology.”22
Research on anchoring suggests that the portfolio manager will enter different revenue growth numbers into his model in both of these scenarios. The scariest part is that the manager won’t even know this occurring, because anchoring effects are influencing his decision-making process at the sub-conscious level.
Framing
Framing is another bias that creeps into our decisions without our knowing we are being influenced. The bias occurs because different ways of presenting information can evoke different emotions, which then leads to different decisions.
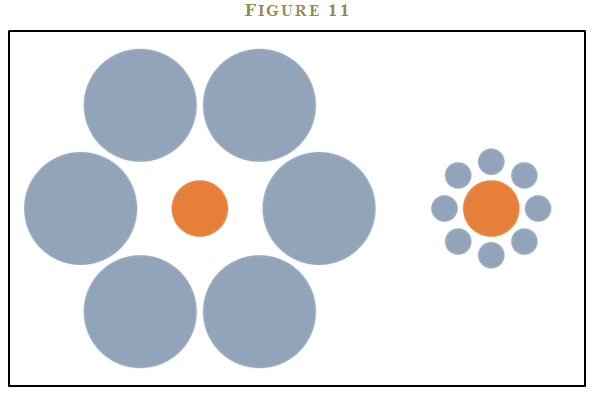
Consider the two orange circles in figure 11. 23 Even though the orange circles are the same size, it appears that the circle on the right is larger than the one on the left because of framing. The right circle is surrounded by smaller circles, causing our brains to perceive the right circle as being large when compared with the surrounding smaller circles. However, the left circle is surrounded by larger circles, leading our brain to interpret it as being relatively smaller than the right circle. Go ahead, stare at the circles as long as you’d like. Our brains are programmed to perceive the two circles differently, based on the context, or frames, even though they are exactly the same size.
Amos Tversky and his colleagues study framing by changing how questions are asked. 24 They find that the same information can be conveyed using two different frames and people will respond in completely different ways, depending on which frame is used.
I highlight a few representative examples below:
Do you prefer ground beef that is…
- 75% lean?
- 25% fat?
Who would ever want “fat” beef? Most people will choose ground beef that is 75% lean over 25% fat, without recognizing that the questions are exactly the same. Another example:
Do you prefer a medication that has a …
- 90% chance of keeping you alive?
- 10% chance of killing you?
Our brains immediately think “Staying alive or dying?—that’s an easy question. I choose alive.” Of course, we have to strain a bit to realize that the two propositions are exactly the same.
One doesn’t have to think too hard to see how a financial advisor with training in psychology could influence her customers. Consider a financial advisor who tells her client the following:
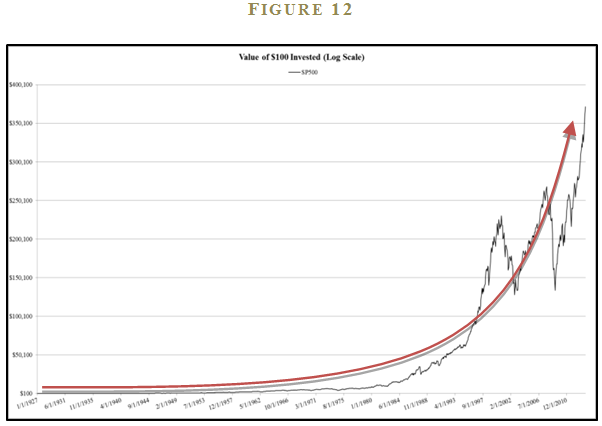
“Stocks are better for the long run because they earned 9.91% a year from 1927 through 2013.”
Take that same financial advisor, but have her frame the information a bit differently:
“Stocks are better for the long run because they grew $100 into $371,452 from 1927 through 2013.”
This same advisor frames the information in a chart:
Although the advisor technically offered the exact same information (stocks grew at 9.91% from 1927 to 2013), the framing of the second statement alongside a fancy chart will encourage the client to allocate more to stocks. The thought of turning $100 into $371,452 is much more appealing at first glance than earning a “measly” 9.91% a year, which is an abstraction with less immediately perceived value.
Availability Bias
Availability bias is an artifact of System 1, which causes our mind to overemphasize the importance of recent or easily recalled information. An applied example: Imagine someone asks you whether there are more English words that begin with a “k” or have “k” as the third letter? Your mind is slowly churning: kid, kiss, key…
Found any words with “k” as the third letter?
Probably not—it’s difficult to recall these words. By contrast, words starting with a “k” spring effortlessly to mind. Naturally, words that start with a “k” must, therefore, be more prevalent in the English alphabet, right? Wrong. There are three times as many words that have “k” in the third position in the English language than there are words beginning with “k.”25
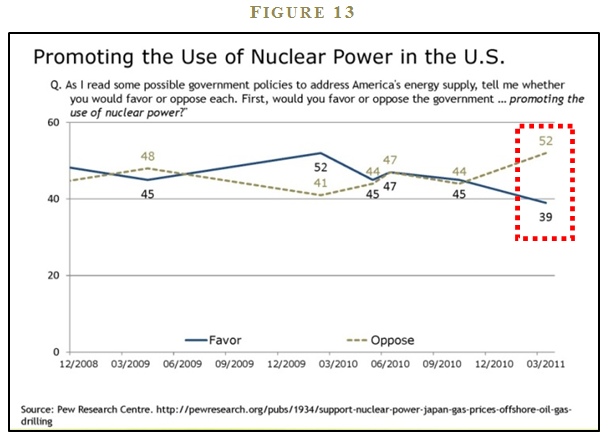
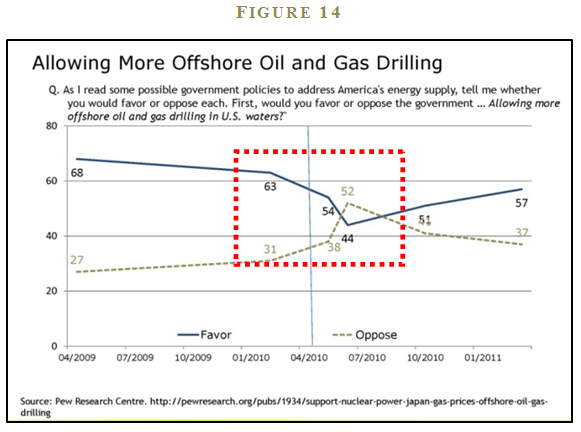
We see availability bias in a number of contexts when there is an “availability shock” in the news media. Two recent examples include the Fukushima Nuclear Disaster in Japan (see Figure 13) and the BP oil spill in the Gulf of Mexico (see Figure 14).
Pew Research Center conducts periodic sentiment polls on the use of nuclear power and oil and gas drilling in the United States. The polls clearly show how recent events—especially those spectacularly displayed in the media—can change implicit assessments of disaster probabilities. For example, sentiment on the use of nuclear power in the U.S. shifts from an even split in June 2010 to 52% opposed and 39% in favor in March 2011. Similarly, in March 2010, 62% favored and 31% opposed offshore oil and gas drilling. However, after the BP oil spill disaster in the Gulf of Mexico, the June 2010 poll numbers are 52% opposed and 44% in favor of offshore drilling.
Perhaps you don’t believe there are behavioral investing implications? All one needs to do is read the Franklin Templeton Annual Global Investment Sentiment Survey, which asked investors—after the fact—to estimate the S&P 500 index performance for 2009 and 2010. 26 66% of investors believed the S&P 500 was down or flat in 2009 when the S&P was up 26.5%; 49% thought the market was down or flat in 2010 when the S&P was up 15.1%. The massive drawdown associated with the 2008 Financial Crisis obviously left a stinging—and available—impression on market participants.
Physical State
“How were you feeling when you got out of bed thirteen years ago, when you’re looking at historical simulations? Did you like what the model said, or did you not like what the model said? It’s a hard thing to back-test.”
–Jim Simons, CEO, Renaissance Technologies, LLC
Any coffee drinkers out there? If I don’t have my coffee in the morning I feel sluggish and my head starts pounding. If you were to lay out a set of financials for a firm and demanded an earnings forecast, I guarantee you that my answer will be highly dependent on my coffee consumption that morning. Physical state, while often overlooked by those discussing behavioral finance, is probably the most intuitive and compelling reason why a human expert can have the same set of facts, and yet come to different conclusions.
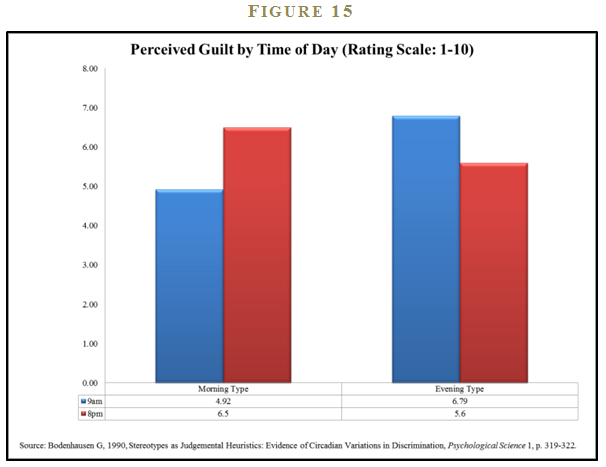
An interesting empirical study highlights the power of basic biological impulses (circadian rhythm) on the human mind. Bodenhausen conducts a study highlighting varying degrees of discrimination exhibited by individuals who self-identify as either “morning types” or “evening types.”27 Each individual is asked, at different times of the day, to state his opinion on the guiltiness of a suspect associated with an alleged crime. The descriptions of the suspects are purposely stereotyped in a way that should appeal to innate discrimination, thereby triggering System 1 heuristic decision-making.
The author tabulates the results for the perceived guilt by the time of day for all participants in the study. Figure 15 breaks out the results for the 9:00 am and 8:00 pm surveys for both morning and evening types. Morning types were more likely to give a suspect the benefit of the doubt when they were feeling bright and chipper early in the day, but much more likely to view the suspects as guilty when asked later in the day when their minds were wandering. Evening types exhibited the same pattern but in reverse. Suspects were more likely to be considered guilty by the evening types in the morning when they were presumably grumpier and less aware, but these same individuals were more lenient on suspects when asked in the evening, during a time when they were feeling awake.
The authors conclude that circadian rhythms that govern daily wakefulness patterns can affect decision-making. Is it fair or sensible that circadian patterns can affect the treatment of suspects on trial? Not really, but trial defense lawyers picking potential jurors for a morning trial should focus on identifying morning types who’ve had their 24 oz. Starbucks coffee!
Section 5B: Story-Based, not Evidence-Based Decisions
My daughter asks, “How did we get these presents under the Christmas tree, Daddy?” I respond, “Oh, Santa dropped them off.” She retorts, “How did he bring them here?” I reply, “On his sleigh, guided by his reindeers.” My daughter comes back, “Oh, yeah, that makes sense. He even ate the cookies we left by the fireplace and his reindeers ate the carrots we left outside.”
Human beings have strong preferences for coherent stories and often build powerful narratives to help interpret complex situations. In my daughter’s case, the impossible physics of the Santa story will gradually break down the story over time, but the powerful Santa Claus narrative will likely extend well beyond what many would consider its “rational life.” The Santa Claus story is one that appeals to many young children28, but it is not just they who suffer from a strong belief in stories, adults are susceptible as well.
Skinner’s Pigeons
The foundation for our persistent belief in stories, in spite of evidence suggesting a story is literally unbelievable, has perplexed researchers for many years. The behavioral psychologist B.F. Skinner and several colleagues demonstrated that our innate need for superstition is deeply ingrained in our primal brains.29 To make the point, Skinner studied one of the more powerful brains in the animal kingdom—the pigeon (see Figure 16 30).
Skinner put hungry pigeons in a cage and dispensed food pellets to them every five seconds. Now, pigeons will naturally wander around any space looking for food and will do so in predictably pigeon-like ways. One pigeon might step to the left and then step to the right; another pigeon might jump, land, and then jump again. Following these random movements, a food pellet will inevitably appear, consistent with the five-second release pattern. After a few rounds of engaging in the same random activities and earning a series of food pellets, the pigeons develop an internal story that their deliberate actions in the cage are causing food pellets to pop out of the feeder.
Amazingly, once a pigeon establishes such a superstition, it is exceedingly difficult to train the pigeon out of the story. Skinner attempts to give the pigeons evidence that their superstition is worthless, but the pigeons continue with their story-based ways. Evidence has a hard time entering the decision-making process once a behavior has been established.
Pigeons aren’t the only animals suffering from “story bias.” But there are other behavioral investing examples. My uncle is convinced that a Dallas Cowboys victory during the Thanksgiving Day football game is a great signal for the stock market. A great story? I guess. A great story, also backed by robust empirical evidence? Not exactly. And even if it were backed by evidence, you would be hard-pressed to raise investment capital to invest in the strategy.
But perhaps the “Dallas Cowboys” indicator is a bit far-fetched. How about the “52-week low” stock screen? Many of my stock-picking friends love this screen, thinking that 52-week low stocks are “cheap,” on average, and therefore must offer the potential for great return relative to other stocks in the investment universe. Unfortunately, “52-week low stocks” are synonymous with what academic researchers call “low momentum stocks.” Low momentum stocks, for those who shy away from reading academic finance journals, have been shown to be one of the worst-performing groups 31 of stocks one can own.32
There are many other stock market superstitions—sell in May and go away; let your winners run, but cut your losses; head and shoulders patterns; this is a stock-pickers’ market; invest in what you know; buy with a margin of safety; and so forth. Some of these stories are backed by evidence, others are not. The main point is that one’s investment process should not be based on a story, but rather, on an evidence-based process that demonstrates robustness over time. Below, I outline three common stories (there are many more), where empirical evidence is lacking.
Story #1: Warren Buffett Beats Ben Graham
Ben Graham, Warren Buffett’s mentor, and original employer, had a strict focus on margin of safety. Graham’s investment philosophy was to always buy cheap and never stray from a low-price strategy. The essence of Ben Graham is captured in two of his recommended investment approaches:
- Purchase stocks at less than their net current asset value, a strategy Graham considered “almost unfailingly dependable and satisfactory.”33
- Create a portfolio of stocks a minimum of 30 stocks meeting specific price-to-earnings criteria (below 10) and specific debt-to-equity criteria (below 50 percent).34
Both of these investment approaches maintain an overarching theme involving paying a low-price, independent of quality. When Buffett came into the spotlight, he suggested a wrinkle in Graham’s original approach. Buffet’s own words capture the flavor of his investment approach:
“It’s far better to buy a wonderful company at a fair price than a fair company at a wonderful price.”35
In a Buffett world, Coke at a price-to-earnings ratio of 20 might be a value stock, but the textile firm Berkshire Hathaway may be overpriced at a P/E of 5. In a Graham world, Berkshire Hathaway is always the better bet. Anecdotally, it is easy to claim that Buffett was the clear winner in the horse race against Graham. But are we suffering from availability bias or story-bias when we make this conjecture?
What does the actual evidence have to say on the subject?
I can empirically verify whether a Buffett or Graham philosophy has been more effective over the past 37 years. To do so, I need to quantify Warren Buffett and Ben Graham’s strategies in a systematic way. Joel Greenblatt, famous for his book, The Little Book that Beats the Market, tells a story about a systematic investment approach that encapsulates the Warren Buffet mantra of trying to “buy a wonderful business at a fair price.” Greenblatt’s formula is straightforward: Rank all stocks on their earnings before interest and taxes relative to their total enterprise value (EBIT/TEV). EBIT/TEV serves as the “cheapness” indicator for a given security (labeled “Graham” in Table 1). Next, measure the “quality” of a firm by calculating the ratio of EBIT to capital (labeled “Quality” in Table 1), which satisfies Buffett’s own criteria that the “more appropriate measure of managerial economic performance is return on equity capital.” 36 To generate the Warren Buffett clone strategy, we simply average the EBIT/TEV and EBIT/CAPITAL ranks and then purchases the top-ranked stocks based on the combined “cheapness” and “quality” ranking (labeled “Buffett” in Table 1).
Table 1 figures are from our book, Quantitative Value. 37 The performance metrics are calculated over the 1974 to 2011 timeframe and the universe consists only of investable firms (we eliminate small/micro caps). The far left column is the performance of Warren Buffett stocks as captured by Greenblatt’s combined cheapness and quality measure. The second column represents the Graham cheap-stock strategy using only EBIT/TEV as the sorting variable. The third column is the stand-alone quality measure. The fourth column is the S&P 500 total return index. Each active strategy ranks stocks on the respective metric every June 30th and rebalances annually. The results reported represent the performance of the top decile of stocks for a given measure.
The performance for the Buffett formula is admirable over the time period analyzed. Annual growth rates are almost 3.5% higher per year than the S&P 500 benchmark, and the Sharpe and Sortino risk-reward calculations are also stronger. But the Graham strategy outperforms on nearly every metric. The Graham strategy beats the market by over 5% a year, on average, and risk-reward metrics are much stronger than both the benchmark and the Buffett strategy. The evidence supports the argument that the original Graham value-investment philosophy is superior to the updated Buffet value-investment philosophy.
How is it possible that Graham beats Buffett? The answer lies in the quality component of the Buffett philosophy. If we examine the quality strategy’s stand-alone performance we notice that the results are slightly weaker than the benchmark, suggesting that any strategy that moves out of cheap stocks with a quality component will correspondingly dilute overall performance. We see this borne out in the Buffett results, which represent a mix of a quality component and a low-price component. As we summarize in Quantitative Value, “[an equally weighted combination of quality and price algorithm] systematically overpays for quality. It is structurally flawed, leading us to fish in the wrong pond.” The lesson from the evidence is that Graham was correct, on average. And yet, the story of value-investing has slowly evolved away from strictly buying cheap stocks to buying stocks across the price spectrum based on quality attributes that are not useful if a stock is not cheap. Unfortunately, this revamped value investing story is not backed by robust empirical evidence. Warren Buffett is merely an anecdote associated with a great story, but the tale told by Graham should maintain its status as the “golden rule of value investing.”
Story #2: Economic Growth Drives Stock Returns
Should investors favor strong economic growth? Of course, they should if they want to earn high returns. Strong growth drives profits, which drives returns.
If economic vitality didn’t matter, all the time spent pontificating over economic figures and developing growth forecasts associated with these estimates would be a complete waste of time, right? Not so fast. I’m going to let you in on a secret: investors focused on economic growth are wasting their time.
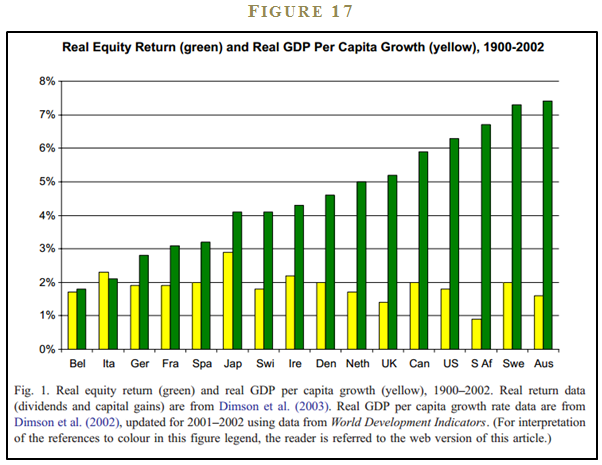
Jay Ritter tells a compelling evidence-based story that economic growth doesn’t benefit stockholders. 38 If anything, the evidence suggests a negative correlation between equity returns and GDP growth. 39 Figure 17 shows the relationship between real equity returns and real per capita GDP growth for 16 countries over the 1900-2002 period—over a 100 year testing period!
The figure highlights the fact there is no relationship between stock returns and GDP growth. And yet, investors are so focused on the powerful narrative that GDP growth increases corporate profits, they forget to review the underlying theory or evidence sustaining this bogus story. First, from a theory perspective, the only way a firm increases stockholder value is by investing firm capital in positive net present value projects. And it is unclear why strong economic growth will contribute to a firm’s ability to identify more, or higher-yielding, investment projects in a competitive economy. Buffett made this point painfully clear in his famous 1999 article in Fortune magazine. First, the oracle rattles off a handful of transformative high-growth industries that translated into terrible investments (e.g., airlines, automobiles, radios, and televisions). He then leaves us with a profound statement that lays out a logical case that investors shouldn’t fall in love with growth for growth’s sake:
“The key to investing is not assessing how much an industry is going to affect society, or how much it will grow, but rather determining the competitive advantage of any given company and, above all, the durability of that advantage. The products or services that have wide, sustainable moats around them are the ones that deliver rewards to investors.”40
Buffet reminds investors why they shouldn’t cling to macroeconomic growth stories. So, in which area should investors focus? As Ritter says quite succinctly: “current earnings yields.” Translated for non-finance geeks, this simply means price. And as any intelligent investor will tell you, the price you pay has everything to do with the returns one will receive. If an investor pays a high price for a given asset, they can expect low returns; if the same investor pays a low price for a given asset, they can expect high returns. The real story here is that high equity returns are earned by investors who focus on paying low prices for firms with strong abilities to invest in positive net present value projects. It may be that the best prices can be had in times of low economic growth, whereas we tend to overpay in a growing economy. The idea that strong economic growth translates into strong stock returns is a superstition, not backed by evidence.
Story #3: The Payout Superstition
Every quarter, boards across America wrestle with the complex question of dividend policy. Perhaps the company has excess cash that should be paid out as a dividend? Or perhaps cash should be directed to high net-present-value projects? It’s a nuanced and sophisticated debate, which makes it the perfect breeding ground for generating investor superstitions.
Quant heavyweights Cliff Asness (AQR) and Rob Arnott (Research Affiliates) have noted that market observers often predict that low dividend payout ratios imply higher earnings growth in the future. 41 Conversely, when dividend payout ratios are high, commentators suggest that earnings growth will slow in subsequent years. I call this story the “payout superstition.”
Again, the logic seems to make sense: if companies retain earnings (i.e., low dividend payout) and plow them back into promising projects, earnings growth should be higher in the future; conversely, if companies don’t see any growth opportunities, they will push cash back to shareholders (i.e., high dividend payout) and future earnings shouldn’t experience robust growth.
The payout superstition is a great story, but is this really how the world works from an empirical standpoint?
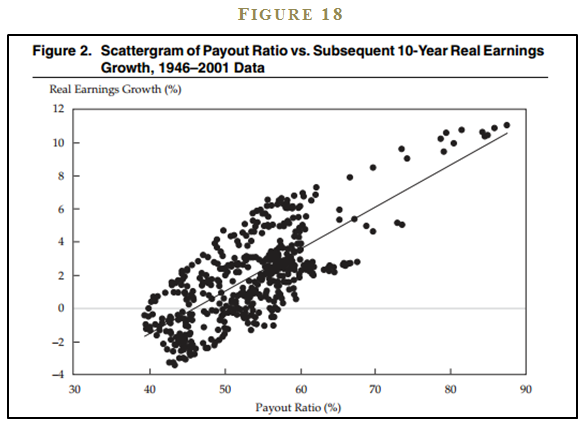
Arnott and Asness looked at historical payout ratios and earnings growth of stocks broadly representative of the market. Figure 18 is a scatterplot showing payout ratios and subsequent ten-year real earnings growth from 1946-2001.
The evidence indicates there is a positive relationship between payout ratio and future earnings growth. That is, higher dividend payout ratios predict higher growth, while lower payout ratios predict lower growth—the opposite of the payout superstition. As my 2-year old says after dropping food from the table: “Uh-oh.”
Asness and Arnott suggest a few hypotheses for why this might be true:
- Since managers don’t like to cut dividends, if they are concerned about the sustainability of earnings in the future they would not offer a higher dividend today; a higher payout ratio is a signal that they think future prospects look poor.
- When earnings are not paid out, cash is used to finance poor investments (malinvestment), leading to reduced earnings growth.
- When managers hold cash, it may signal “empire building,” where managers try to increase their power, rather than act to benefit shareholders.
Arnott and Assness’s analysis suggests that if a firm has extra cash, there are reasonable arguments why they should pay out cash as dividends, rather than hold it or invest it in disastrous projects that could destroy value. In a world where malinvestment and empire-building are pervasive, dividends might provide a valuable signal about a firm’s shareholder policies. And perhaps mischievous corporate managers are exploiting the payout superstition for their own benefit?
The Moral of the Stories
The number of fairy tales, rules of thumb, and other sorcery sold in the financial markets are too numerous to list. I’ve highlighted three of the more coherent and believable stories in the marketplace that are called into question by empirical footings. The lesson is clear for all of us who enjoy a great investment pitch: In order to be good investors, we need to appreciate our natural preference for coherent stories, and our innate dislike for evidence. Don’t be the pigeon doing a “pellet voodoo dance,” when it has already been shown that the pellet voodoo dance doesn’t work.
Section 5C: Overconfidence
“We are prone to overestimate how much we understand about the world and to underestimate the role of chance in events.”
–Dan Kahneman, Thinking, Fast and Slow.
Overconfidence, or the inability to appropriately calibrate our forecasts, is often cited as among the most robust empirical finding in psychology experiments.
Let’s try a game.
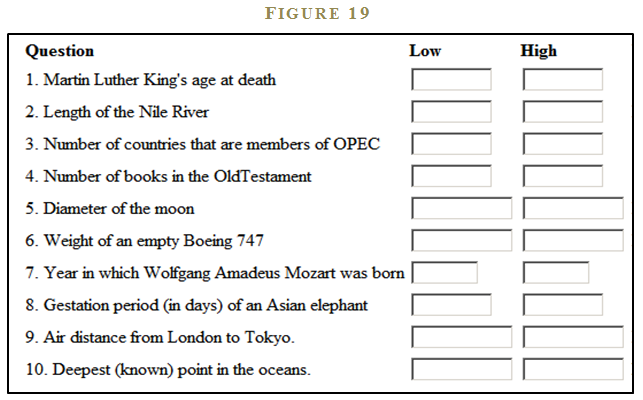
Spend a couple of minutes identifying a low and high-value answer to the questions in Figure 19, such that you are 90% confident the answer lies in between your upper and lower bound. To be clear, answering “negative infinity” and “positive infinity,” while clever, is missing the point of the game. You want to calibrate your upper and lower bound appropriately: not too cold, not too hot—just right. Go for it.
If you are like most people who play this game, you are reliably overconfident. My own ad-hoc experimental evidence (around 1,000 participants) on this questionnaire is that individuals typically get 3/10 correct when a well-calibrated individual should on average get 9/10 correct, consistent with the confidence interval. This low-scoring result holds even when I warn test-takers that prior test-takers have been systematically overconfident in their upper and lower bounds. I then encourage them to increase the bounds of their ranges. Of course, nobody listens, and on average, only 3/10 of the correct answers actually sit within the individual’s confidence range. We are hard-wired to be overconfident.42
What cognitive biases are causing us to be overconfident? One answer may lie in our human desire to pursue and misuse useless information. Our brains immediately interpret more information as better information, which leads to more confidence, with no corresponding increase in forecast accuracy.
There is a great study by Bastardi and Shafir appropriately titled, “On the pursuit and misuse of useless information.”43 The paper is filled with experiments that show our brain’s inability to properly process information in a variety of circumstances. The abstract of the paper says it best:
“Decision makers often pursue noninstrumental information–information that appears relevant but, if simply available, would have no impact on choice. Once they pursue such information, people then use it to make their decision. Consequently, the pursuit of information that would have had no impact on choice leads people to make choices they would not otherwise have made.”
Here is an example experiment from Bastardi and Shafir’s research. The authors ask different groups to make a decision on a mortgage application. One group is faced with the following information set:
Group 1: Imagine that you are a loan officer at a bank reviewing the mortgage application of a recent college graduate with a stable, well-paying job and a solid credit history. The applicant seems qualified, but during the routine credit check you discover that for the last three months the applicant has not paid a $5,000 debt to his charge card account.
- Do you approve or reject the mortgage application?
Group 1 approves only 29% of the applications and rejects 71%.
The authors play a trick on the second group by leading them to believe they have more information. The hypothesis is that the subjects will interpret their supposed “special information” as information that can lead to a more accurate decision.
Group 2: Imagine that you are a loan officer at a bank reviewing the mortgage application of a recent college graduate with a stable, well-paying job and a solid credit history. The applicant seems qualified, but during the routine credit check you discover that for the last three months the applicant has not paid a debt to his charge card account. The existence of two conflicting reports makes it unclear whether the outstanding debt is for $5,000 or $25,000, and you cannot contact the credit agency until tomorrow to find out which is the correct amount.
- Do you approve or reject the mortgage application or wait?
Only 2% of the respondents approve the application, while 23% reject the application, and a majority (75%) chooses to wait for the additional information. For the majority who wait a day to get the additional information, the authors present them with the following tidbit:
Next day they find out the amount is $5,000
- Do you approve or reject the mortgage application?
For the majority who held out, 72% approve the application and 28% reject the application. In sum, for group 2, 54% approve the application and 21% reject the application. The approve rates are substantially higher than for group 1.
What is going on in this experiment? The authors have effectively given group 1 and group 2 the exact same information set, but because it is meted out over time, the second group perceives they have more information, which changes their decision-making process. Humans are cognitively inclined to overvalue information that requires effort or time to obtain.
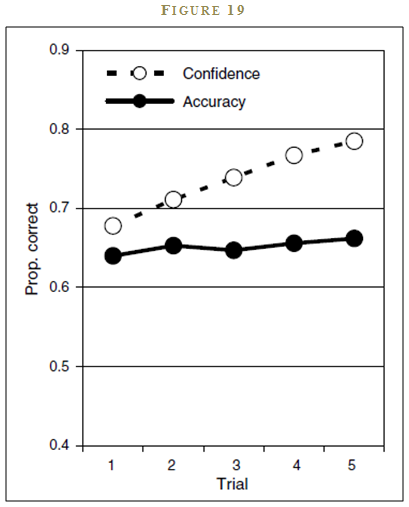
Is there a behavioral investing application? To make the point more vividly that more information doesn’t necessarily translate into better decision making, Professor Claire Tsai and colleagues directly test the relationship between information and forecast accuracy.44 The “rational” hypothesis suggests that each information piece received will be appropriately weighted and integrated into a forecast. Confidence in the forecast will be updated via appropriate statistical means (i.e., Bayesian updating). The “irrational” hypothesis is that humans will interpret more information as better information, without considering whether the additional information actually enhances their forecast ability. The prediction is that forecast accuracy will not improve as people receive more information, but their confidence in their forecast will increase linearly with more information.
The authors collect subjects who self-identify as being knowledgeable about college football. They present different subjects with up to 30 data points. The subjects are then asked to present a forecast for football game outcomes and their confidence in their forecast. To spice things up a bit, the researchers give the subjects the information set in such a way that they receive the most predictive pieces of information first and each subsequent piece of information is less and less useful for predicting football game outcomes.
The results of the study support the human hypothesis and reject the econ hypothesis. Humans incorrectly interpret more information as better information. Their forecast accuracy does not improve with more information, but their confidence in their forecast grows linearly with the amount of information received.
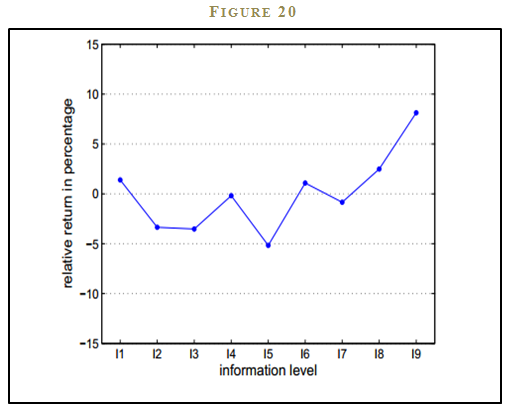
A team of theoretical physicists and social scientists examine the effect of information on forecast accuracy and confidence.45 The researchers create an experimental trading lab where traders are randomly given different information sets with nine different levels of information. I1 has no information; I9 is essentially an insider, with a nearly perfect information set. Once traders receive their information sets, they play a live trading game where the subjects try to maximize their returns. The intent of the experimental design is to capture an element of the real-world marketplace where some traders are better informed than others and these traders trade with each other in financial markets. Amazingly, only the most informed traders with complete insider information can reliably beat the market. While it is unsurprising that a total insider could beat the market, it is striking that the partially informed traders do not. While the partially informed traders should outperform the market because they have privileged information, they do not largely because they suffer from overconfidence and overvalue their own information set, and therefore can’t use it effectively. In fact, partially informed traders on average, underperform. Uninformed investors, who know they have no information, are less likely to suffer from the cognitive bias of overconfidence, and thus end up achieving the market return, which in this experimental setting, is an admirable achievement.
What are we to make of this study? Is the takeaway that insider information is helpful for generating market-beating returns? Well, no kidding. In a game setting, we would all trade on insider information if we had it. However, in the real-world, we must weigh the benefits of beating the market relative to the direct costs of being holed up in a prison cell wearing an orange jumpsuit and the indirect costs of having to shamefully stare into the mirror every morning.
And for the rest of the traders in the marketplace with partial information sets? These investors should be wary of interpreting their information as a way to enhance performance. If the experimental evidence is any guide, it is more likely that additional information is causing us to make worse decisions, not better decisions. We must always ask ourselves if the information we are collecting is adding value by enhancing our forecasts or detracting from value by making us more overconfident.
In addition to correctly assessing the value of the information we receive, we must avoid self-attribution bias, which is our innate desire to attribute good outcomes to skill and bad outcomes to back luck. A good trade does not necessarily imply that the investor was better at “doing their homework,” nor does a bad trade necessarily imply that the investor did a poor job of “doing their homework.” And yet, our minds will often attribute the successful trade to our wonderful ability to collect and interpret mounds of filings submitted to the SEC, our ability to do the “hard work” of conducting channel checks on suppliers and customers, and our magnificent skill in being better than the average investor in the marketplace. Of course, when we endure a poor trade, we don’t attribute the bad performance to a lack of skill, but instead, the bad trade can be squarely blamed on bad luck: an unforeseen change in government policy, or perhaps a remarkable change in the price of underlying commodities that “nobody could have seen coming.”
A better approach for dealing with success and failures is to systematically discount success and overemphasize failures. Flip self-attribution bias on its head, or as Charlie Munger, Vice Chairman of Berkshire Hathaway, is often attributed as saying, “Invert; always invert.” While unappealing to most, reiterating that we are not as smart as we thought we were and realizing the pain of bad decisions can actually make us stronger, since it is a more accurate representation of reality. As we say in the Marine Corps, “Pain is weakness leaving the body.”
The potent combination of overvaluing additional information and self-attribution bias contribute to systematic and predictable overconfidence for discretionary decision-makers. This overconfidence leads to value-destroying decisions in the context of financial markets.
SUMMARIZING WHY EXPERTS FAIL TO BEAT MODELS
The expert hypothesis is based on the following flawed assumptions:
- Qualitative information increases forecast accuracy.
- More information increases forecast accuracy.
- Experience and intuition enhance forecast accuracy.
The assumptions underlying the expert’s hypothesis are empirically invalid because: “Soft,” or qualitative, information doesn’t enhance forecasting ability; more information doesn’t enhance forecasting ability; and experience doesn’t enhance forecasting ability.
Systematic models work because the human mind is reliably unreliable.
Let us push reality aside for a moment, and make the claim that most of us are truly evidence-based decision-makers who are not influenced by stories that capture our imagination and impact our decision-making ability. If we are truly empirical-based individuals, the evidence overwhelmingly suggests that we should all be using models and other algorithms to make decisions, rather than relying on experts.
But who is ready to concede that a machine is better at making decisions? You are probably like me: the idea of scrapping my years of hard-won experience is awfully hard to swallow. (see Figure 20. 46)
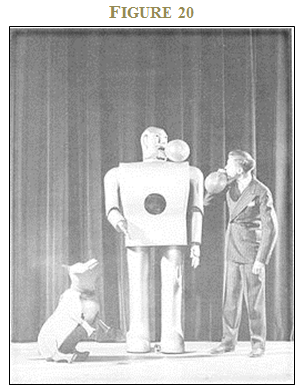
Humans naturally seek to fulfill what Maslow—famous for developing the human hierarchy of needs47 —calls our innate need for esteem and self-actualization. We want to feel that our opinions and judgment matter. Recognizing the fact that simple models outperform experts directly challenges our self-directed desire to achieve goals, gain confidence, and feel a sense of achievement. We want to feel like our efforts are worthwhile, but we often devote little effort to understanding if our frenetic activity actually adds value.
Consider the act of banging one’s head against the wall for 10 hours a day, 7 days a week. Banging your head against the wall involves a lot of activity, but because the outcome of this activity is clearly “bad,” it is easy to know that this focused effort is a waste of time. However, what if we are spending 10 hours a day contacting CEOs about the prospects of their companies? Is this intense activity valuable? Are we learning anything that is actually helping us? A lot of investors assume it is, but have they ever systematically reviewed this assumption? Maybe this, or other, so-called “value-add” activities performed by experts is equivalent to banging one’s head against the wall? Perhaps the activities are detracting from value, not contributing to value?
I can’t say with certainty, but based on the bevy of tests cited above, I can conjecture that while the analyst is clearly collecting more information, the information may do nothing to enhance the analyst’s forecasting ability. In fact, it is quite likely that the additional information detracts from our ability, as the analyst becomes systematically overconfident in his forecast of the future. Overall, any potential information edge that may exist is overwhelmed by costs associated with cognitive bias issues.
Section 6: Why not use models?
Imagine you are watching Gary Kasparov, Russia’s preeminent chess master, taking on IBM’s Deep Blue, a cold, calculating box designed by a bunch of geeks. (See Figure 2148 ).
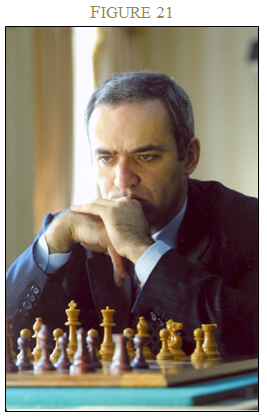
During the match, Gary is sweating it out, smiling when he makes a nice move, and cringing in pain when Deep Blue takes his queen. We see that Gary is like us. He is familiar; the machine is just an inhuman metal box. The machine has no emotion, no feelings, no empathy. Who do we want to win the match? We want Gary. He’s like us and we have a preference for the familiar (yes, another bias, I know). Nobody wants a computer to win.
And so what if the machine is actually better at chess than a human? We get it: Deep Blue with its ability to analyze 200 million positions per second, can best a human opponent. Does that mean we want a chess-playing computer mainframe making our life and death medical decisions—even if the evidence suggests we should? Humans might be willing to put up with a flawed, but familiar human, because we empathize with flesh and blood. If the heart surgeon kills my aunt because he accidentally tied the tubes the wrong way, that’s unfortunate, and I’m angry, but “people make mistakes, we’re all human.” But imagine if a robot performs surgery on my aunt and she dies because the robot tied the tubes the wrong way. My immediate reaction: “Who in the heck thought it was a good idea to have a robot perform heart surgery—Where’s my lawyer!” However, the truth is, the robot is much less likely to make such a mistake, on average. We should be rooting for machines that make fewer errors, not excusing human error.
Even if one buys the argument that models can be useful, one might object that models are too limited and cannot be applied in sophisticated contexts like investment decision making. What, for example, is the algorithm going to say when we face a unique situation the world has never seen? This time is actually different.49 The story is that the human expert can adapt and create on-the-fly modifications to the model that create value. This well-trodden, but empirically busted, rebuttal against algorithms is deemed the “broken leg theory” and relies on the false premise that humans don’t suffer from System 1 flaws.
Consider an algorithm that predicts when people will go to the movie theater. A discretionary human expert identifies that someone has a broken leg and is able to update the quantitative model with their “special knowledge” and beat the model. Sounds good in theory; however, as the experimental psychology research shows, humans are unable to properly differentiate between information that actually enhances forecast accuracy and the reams of additional useless information they believe can enhance forecast accuracy. What about the upcoming weather patterns suggesting that rain is imminent? Or what about the fact that the star in the movie was just charged with a DUI on the nightly news? This must matter for predicting movie attendance—or does it?
Without the evidence, and only a story to rely on, we are on shaky ground. In summary, discretionary decision-makers are often able to identify the value-enhancing modifications that can theoretically outperform a simple model, however, they simultaneously identify value-destroying modifications that cause them to underperform. Discretionary experts’ inclination to “modify” simple models resembles a bag of Lay’s Potato Chips—the experts can’t eat just one modification.
Behavioral investing and eating the humble pie
Still think that you are the exception who can reliably add value? We ALL believe we are better than average. The crushing reality is “You are less beautiful than you think.”50
- Are you a better driver than average? 93% of US citizens think so too.51
- Are you a great teacher? 94% of professors think so too.52
- Are you a better than average stock-picker? Of course you are.
Relegating your decision-making processes to systems requires a massive dose of humble pie. Most—if not all—are unable to consume this dish. But to be a better decision-maker we must eat our humble pie. As I have shown in this essay, in order for decision-making to be effective, it must be systematic. And the only systematic thing about humans is our flaws.
Therefore, it is best to leave the stock-picking to Warren Buffett, and for the rest of us, who suffer from behavioral biases, we should stare into the mirror, and ask a simple question:
Am I Trying Too Hard?
Reference:
1 The title concept was inspired by Dean Williams 1981 keynote speech at Rockford College.
2 The inspiration for this piece is based on our book, Quantitative Value, and James Montier’s 2006 Dresner Kleinwort article, “Painting by Numbers: Ode to Quant.”
3 http://video.mit.edu/watch/mathematics-common-sense-and-good-luck-my-life-and-careers-9644/, Accessed 2/10/2014
4 Dr. Barberis is now a professor at Yale University.
5 http://persci.mit.edu/gallery/checkershadow, accessed 2/10/2014.
6 Advancements in “machine learning” and related technologies might change this over time.
7 Marine Rifle Squad, MCRP 3-11.2, Ch 5.
8 I do not mean to single out Meredith Whitney. The same point can be made with just about any analyst who has shown up on CBNC and expressed a confident and detailed opinion on a forecast. Figure source: http://commons.wikimedia.org/wiki/File:Meredith_Whitney_(2852008236).jpg
9 http://online.wsj.com/news/articles/SB10000872396390444549204578021380172883800: accessed, 2/10/2014.
10 Kahneman, D. Thinking, Fast and Slow: New York, Macmillan, 2012, p. 212.
11 In the jargon of academia, the term for experts is “clinician” and the term for models is “actuarial process.” Instead of using “clinical versus actuarial,” I use “models versus experts” to facilitate understanding within our chosen context.
12 Carroll, J., Wiener, R., Galegher, J, and J. Alibrio, 1982, “Evaluation, Diagnosis, and Prediction in Parole Decision Making,” Law, and Society Review 17, p. 199-228.
13 http://online.wsj.com/news/articles/SB10001424052702304626104579121251595240852. Accessed 2/10/2014.
14 Leli, D., and S. Filskov, 1984, “Clinical Detection of Intellectual Deterioration Associated with Brain Damage,” Journal of Clinical Psychology 40, p. 1435-1441.
15 W-B protocol includes information on age, sex, education, intelligence tests, and so forth.
16 http://www.youtube.com/watch?v=tThxb_eFUTo. Accessed 2/10/2014.
17 Greenblatt, J., 2011, “Adding your Two Cents May Cost You a Lot Over the Long-Term,” Morningstar.
18 Grove, W., Zald, D., Lebow, B., and B. Nelson, 2000, “Clinical Versus Mechanical Prediction: A Meta-Analysis,” Psychological Assessment 12, p. 19-30.
19 Kahneman, D. Thinking, Fast and Slow: New York, Macmillan, 2012.
20 Assume there are 200 females, 100 female bank tellers, and 50 female feminists in the world. It is more likely that Linda is a bank teller (100/200=50%) because the subset of bank tellers that are also feminist (best case is all feminist are bank tellers implies 50/200=25%) is much smaller than the population of bank tellers as a group (100).
21 Simonson, I., and A. Drolet, 2004, Anchoring Effects on Consumers’ Willingness-to-Pay and Willingness-to-Accept, Journal of Consumer Research 31, p. 681-690
22 Kahneman, D. Thinking, Fast and Slow: New York, Macmillan, 2012, p. 119.
23 Ariely, D., Predictably Irrational: New York, Harper, 2010.
24 McNeil, Pauker, Sox Jr., and Amos Tversky, “On the elicitation of preferences for alternatives therapies,” New England Journal of Medicine 306 (1982): 1259-62.
25 A. Tversky and D. Kahneman, 1973, Availability: A heuristic for judging frequency and probability, Cognitive Psychology 5, p. 207-233.
26 The Franklin Templeton 2010/2011 Global Investor Sentiment Survey, https://www.franklintempleton.com/investorsentiment, Accessed 2/10/2014.
27 Bodenhausen, G., 1990, Stereotypes as Judgmental Heuristics: Evidence of Circadian Variations in Discrimination, Psychological Science 1, p. 319-322.
28 In my case, I believed in Santa Claus until the age of 14—and still do at times. Physics be damned!
29 B.F. Skinner, 1948, Superstition in the Pigeon, Journal of Experimental Psychology 38, p. 168-172.
30 Image source: http://commons.wikimedia.org/wiki/File:The-King-Of-Rome.jpg .
31 Jegadeesh, N., and S. Titman, 1993, “Returns to buying winners and selling losers: Implications for stock market efficiency,” Journal of Finance 48, p. 65-91.
32 This is not to say that 52-week low is ineffective in every situation, but one needs to be thoughtful when selecting a screening technology.
33 Graham, B., and D. Dodd, Security Analysis, New York: McGraw-Hill, 1934.
34 Graham, B., “A Conversation with Benjamin Graham,” Financial Analysts Journal 32, p. 20–23.
35 Buffett, W., “Chairman’s Letter,” Berkshire Hathaway Inc. Annual Report, 1989.
36 Buffett, W., “Chairman’s Letter,” Berkshire Hathaway Inc. Annual Report, 1977.
37 Gray, W., and T. Carlisle, Quantitative Value: New York, John Wiley & Sons, 2012.
38 J.R. Ritter, 2005, “Economic Growth and Equity Returns,” Pacific-Basin Finance Journal 13, p. 489-503.
39 Ritter find a cross-sectional correlation of -.37 for the compounded real return on equities and the compounded growth rate of real per capital GDP for 16 countries over the 1900-2002 period.
40 Mr. Buffett on the Stock Market, Warren Buffett and Carol Loomis. http://money.cnn.com/magazines/fortune/fortune_archive/1999/11/22/269071/, accessed 2/10/2014.
41 Arnott, R., and C. Asness, 2003, “Surprise: Higher Payout Rates = Higher Growth Rates,” Financial Analysts Journal 59, p. 70-87.
42 The answers are below:
1. 39 yrs
2. 4,187 miles
3. 13 countries
4. 39 books
5. 2160 miles
6. 390,000 pounds
7. 1756
8. 645 days
9. 5,959 miles
10. 36,198 feet
http://www.tim-richardson.net/misc/estimation_quiz.html. Accessed, 2/10/2014.
43 C. Bastardi A, and E Shafir, 1998, “On the Pursuit and Misuse of Useless Information,” Journal of Perspectives on Social Psychology 75, p. 19-32.
44 Claire Tsai, Josh Klayman, and Reid Hastie, 2008, “Effects of amount of information on judgement accuracy and confidence,” Organizational Behavioral and Human Decision Processes 107, p. 97-105.
45 Bence T., Scalas E., Huber J., and M. Kirchler, 2007, “The value of information in a multi-agent market model,” European Physical Journal B 55, p. 115-120
46 Image source: http://commons.wikimedia.org/wiki/File:Elektro_and_Sparko_(263022490).jpg.
47 Maslow, A.H. (1943), “A theory of human motivation,” Psychological Review 50, p. 370–96.
48 Image source: http://commons.wikimedia.org/wiki/File:Garry_Kasparov,_New_York_City,_2003.jpg.
49 E.g., “The fed has never intervened in the market like this.”
50 http://www.scientificamerican.com/article/you-are-less-beautiful-than-you-think/, accessed 2/10/2014.
51 Svenson, O., 1980, “Are we all less risky and more skillful than our fellow drivers?” Acta Psychologica 47, p. 143-148.
52 Cross, P., 2006, “Not can, but will college teaching be improved?” New Directions for Higher Education 17, p. 1-15.
About the Author: Wesley Gray, PhD
—
Important Disclosures
For informational and educational purposes only and should not be construed as specific investment, accounting, legal, or tax advice. Certain information is deemed to be reliable, but its accuracy and completeness cannot be guaranteed. Third party information may become outdated or otherwise superseded without notice. Neither the Securities and Exchange Commission (SEC) nor any other federal or state agency has approved, determined the accuracy, or confirmed the adequacy of this article.
The views and opinions expressed herein are those of the author and do not necessarily reflect the views of Alpha Architect, its affiliates or its employees. Our full disclosures are available here. Definitions of common statistics used in our analysis are available here (towards the bottom).
Join thousands of other readers and subscribe to our blog.


