Wes and I have a recent paper (found here) which examines a more complete measure of shareholder yield (dividends, net stock repurchases, and debt reduction).
Here is the abstract:
High-dividend-yield stocks do not reliably earn above-average risk-adjusted returns. More complete measures of shareholder yield, which account for net share repurchases, perform better. This article explores the use of net-debt paydown as a way to further enhance shareholder yield. The addition of net-debt paydown enhances risk-adjusted returns and creates a shareholder yield metric that is more robust across time and to the inclusion or exclusion of financials.
Here is a picture (from an older version of our paper) documenting that more complete measures of shareholder yield has performed better compared to dividend yield.
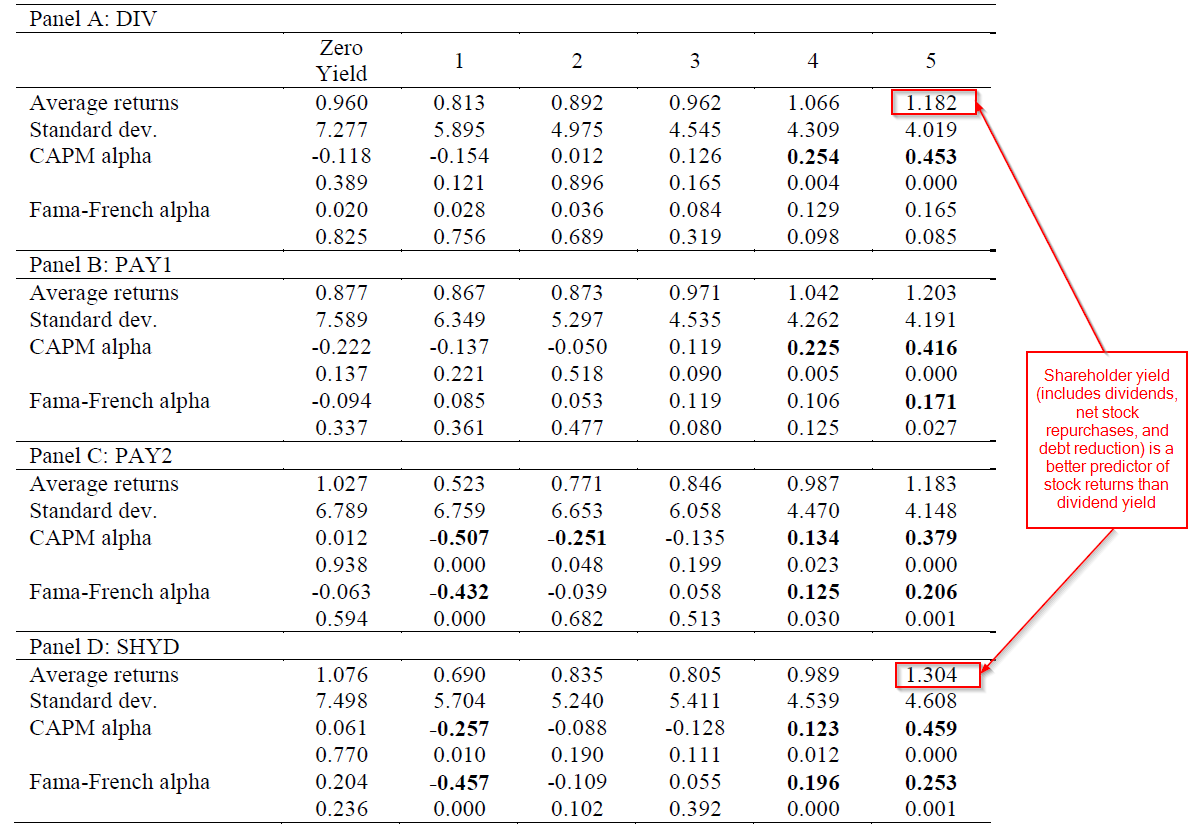
The results are hypothetical results and are NOT an indicator of future results and do NOT represent returns that any investor actually attained. Indexes are unmanaged, do not reflect management or trading fees, and one cannot invest directly in an index. Additional information regarding the construction of these results is available upon request.
We decided to see what would happen if we computed shareholder yield using an average of yield over a longer time horizon. The idea behind this concept was originally proposed by Graham and Dodd in Security Analysis.
We require that all firms have a shareholder yield value for the past 8 years. We then have a look-back period of between 1 and 8 years, and simply take the average of the shareholder yield value over those years. A one year look-back has 1 value, while an 8 year look-back has 8 values. These numerators are then divided by the current market price to generate a shareholder yield measure.
Details:
- Portfolios are formed on June 30th each year and held for one year.
- We examine 1yr, 2yr, …8yr versions of the shareholder yield. (X-axis below).
- Form quintile portfolios based on the shareholder yield average (Quintile 5 is high yield, Quintile 1 is low yield). (Y-axis below)
- Returns are buy-and-hold, with a 1% management fee (1%/12 deducted from returns each month).
Results:
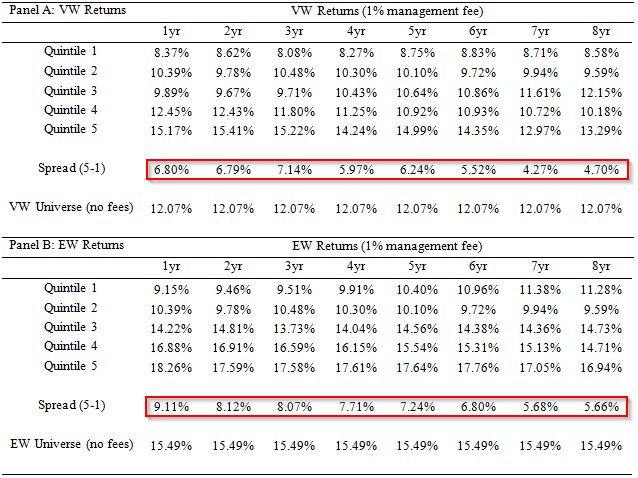
The results are hypothetical results and are NOT an indicator of future results and do NOT represent returns that any investor actually attained. Indexes are unmanaged, do not reflect management or trading fees, and one cannot invest directly in an index. Additional information regarding the construction of these results is available upon request.
Overall, long-term valuations hurt performance, as the spread between high (Quintile 5) and low (Quintile 1) decreases as one uses longer-term yield measurements (in general). In theory, using long-term measures makes sense, but the evidence does not support this story. There may be other considerations such as turnover and taxes, but in the context of the study above, there is no benefit to using longer-term measures. If you still don’t believe this result, check out this other paper Wes and I have on valuation metrics more broadly. A copy of the paper can be found here.
In this article, the authors compare the investment performance of portfolios sorted on different valuation measures. They find that EBITDA/TEV has been the best performing metric, historically, and outperforms many investor favorites, such as price-to-earnings ratio, free cash flow to total enterprise value, and book-to-market ratio. The authors also explore the investment potential of long-term valuation ratios, which replace one-year earnings with an average of long-term earnings. They find that in contrast to prior empirical work, long-term ratios add little investment value over standard one-year valuation metrics.
Looking for a way to invest in this strategy? Check out Meb Faber’s website and ETF. They offer the shareholder yield exposure for a reasonable 59bps.
About the Author: Jack Vogel, PhD
—
Important Disclosures
For informational and educational purposes only and should not be construed as specific investment, accounting, legal, or tax advice. Certain information is deemed to be reliable, but its accuracy and completeness cannot be guaranteed. Third party information may become outdated or otherwise superseded without notice. Neither the Securities and Exchange Commission (SEC) nor any other federal or state agency has approved, determined the accuracy, or confirmed the adequacy of this article.
The views and opinions expressed herein are those of the author and do not necessarily reflect the views of Alpha Architect, its affiliates or its employees. Our full disclosures are available here. Definitions of common statistics used in our analysis are available here (towards the bottom).
Join thousands of other readers and subscribe to our blog.