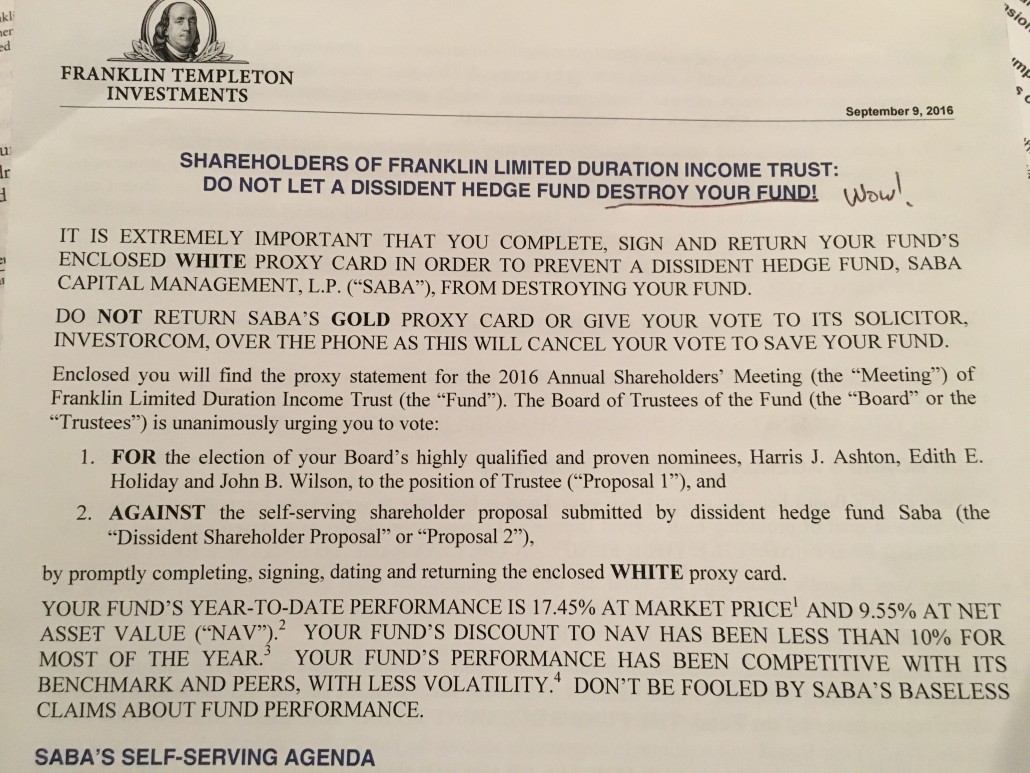
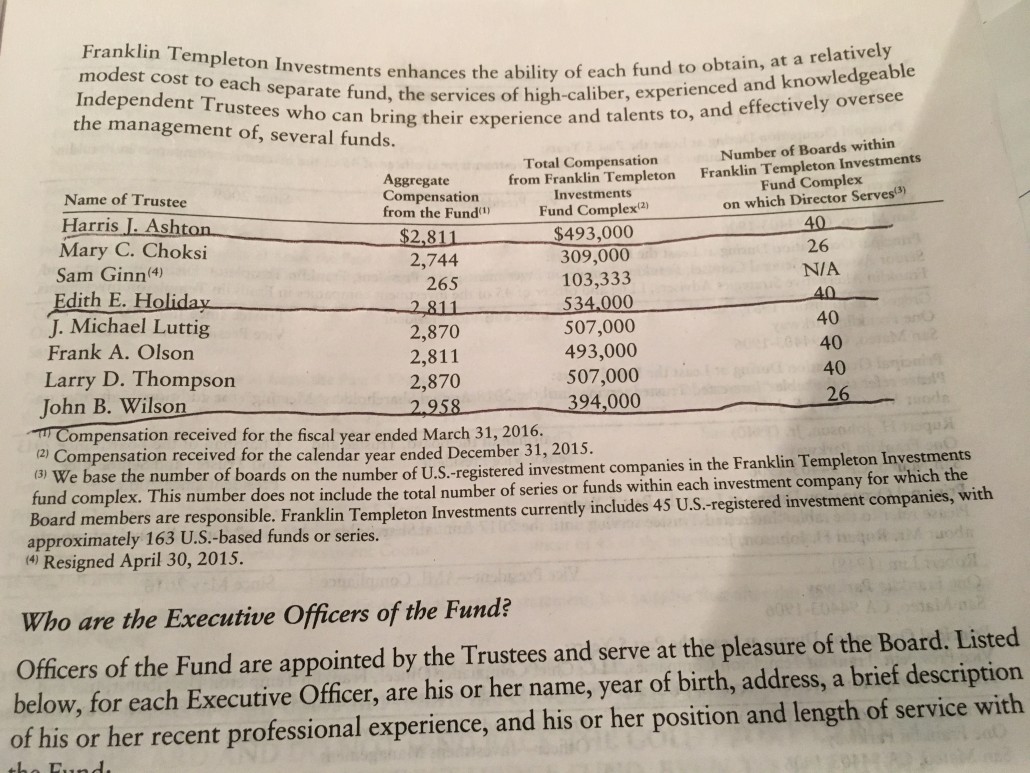
A couple of weeks ago, I received Franklin Templeton Investments’ letter to shareholders of Franklin Limited Duration Trust (ticker FTF) imploring us to not let “self-serving” Saba (an activist shareholder) “DESTROY YOUR FUND” [their bold and all caps, not mine] by pursuing their “‘scorched earth’ approach” first presented to their board on 04/20/16.
Hmmm. Really? This has nothing with protecting your exorbitant board salaries or management fees? You are defending our “fund against Saba’s hit-and-run agenda...”?
Luckily, as a devoted reader of academic financial journals and the Alpha Architect blog, I’m aware that, on average, activist investors like Saba do add long-term value. Part of the abstract from an academic paper discussed on this blog provides a big picture perspective:
We test the empirical validity of a claim that …activist hedge funds, have an adverse effect on the long-term interests of companies and their shareholders…This paper presents a comprehensive empirical investigation of this claim and finds that it is not supported by the data.
The evidence is pretty clear: activists add value, on average.
And as President of Seed Wealth Management, Inc., a firm that is often active in closed end funds, including FTF, I’m also aware that almost all of Franklin’s detailed arguments against the activist investor ring hollow and are largely rhetorical.
But perhaps more important to readers, I’m also aware of both the historical and recent opportunities and risks associated with the closed end fund sector. In this blog post I will review both the current literature on the topic as well as provide some guidance on how investors can best assess the opportunity.
Understanding Closed End Fund Investment Opportunities
For the uninitiated, closed end funds, unlike open-end mutual funds, trade on an exchange, in a manner akin to how an ETF trades. They are “closed” in the sense that the sponsoring company, be it Franklin, BlackRock, Nuveen or any of a host of others, never have to raise cash to cover redemptions. If an investor wants out, they simply sell the shares on the exchange. The market price of a closed end fund (CEF) is thus a simple product of supply and demand and as such can often deviate from the value of the assets it holds (known as its Net Asset Value or NAV). Whereas for an ETF, where an Authorized Participant (AP) can and does keep the NAV and market price from diverging, no such mechanism exists with Closed End Funds, and to the befuddlement of academics, the market doesn’t automatically correct for this mispricing by itself.
This “mispricing” usually occurs at a discounted price to NAV, a finding that was first highlighted in the academic literature over 50 years ago by (Pratt (1966). Since then, scores of papers have been written on the subject, yet the discount still persists. Where does the research stand today? Does the opportunity to profit from this anomaly still exist? Let me try and answer each question in turn.
Closed End Fund Research Review
Closed end fund discounts and premiums are incredibly interesting to academic researchers because they represent a direct assault on the efficient market hypothesis (which roughly stated suggests that prices always reflect fundamental value). In fact, Burton Malkiel of “A Random Walk Down Wall Street” fame, admitted in Malkiel (1977) (a few years after his famous book was published) that the then common explanations (namely unrealized capital appreciation, distribution policy, and high fees) for the anomaly explained only a small fraction of the discount. The anomaly, he posited, represented “a market imperfection” more likely to be due to market psychology. Richard Thaler, a behavioral economist perhaps best known for his battles with the proponents of the Efficient Market Hypothesis, teamed up with others in Lee, Shleifer, and Thaler (1990) to argue that with limits to arbitrage, irrational demand can influence pricing. Likewise, De Long, Shleifer, Summers, and Waldman (1990) (yes, that Summers) made a persuasive and similar case that the discount is due to the predominance of “noise traders,” who are driven more by sentiment than value, over rational investors.
So where does the research stand now and why are researchers still finding the the anomaly worth writing about?
Cherkes (2012) reviewed 70 articles on the subject, and while his review covers a small fraction of available material, he does provide a nice framework for thinking about the evidence, and he also includes examples from the newest literature. Hopefully I can add to and summarize his review and thus provide readers with a sturdier base from which to invest.
The recent research involves four sometimes competing, yet often complementary theories:
- Investor Sentiment (irrational investors)
- Liquidity Based (the fund is more liquid than the sought after assets)
- Manager Ability/Cost (access to smart managers vs their cost)
- Rent-Extraction (another example of Wall Street hoodwinking Main Street)
Investor Sentiment
Thaler and his team followed up their 1990 article by persuasively arguing in Lee, Shleifer and Thaler (1991) that the empirical evidence for mean reversion within the anomaly points to investor sentiment as the correct theory. In other words, learning-impaired investors flock to the sector when optimistic thus reducing the discount and sometimes even creating premiums. On the flip side, too few rational investors are available to stave off the inevitable discount when pessimism prevails. Pontiff (1995) highlights that as a result, investors can make money by simply buying the funds with the greatest discount. Anderson, Beard, Kim, Stern (2011) add to this sentiment explanation by showing a link between the discount and the VIX, a measurement of implied stock volatilty associated with fear.
Liquidity Based Tradeoff with Fees
Academics’s unease with such a blatant behavioral explanation led to others theories such as what Cherkes, Sagi, and Stanton (2009) call the Liquidity Based Theory of Closed End Funds. Simply stated, because funds are never forced to liquidate, the closed end fund structure allows for less liquid underlying securities not otherwise available to investors, all at a reasonable but real cost. In other words, they create liquidity for small investors to invest in less liquid assets with high potential returns. When those returns abate, the trade-off cost of high fees dominates the pricing and CEFs trade at a discount. This, too, explains why closed end investors may flock in herds igniting waves of IPO offerings despite the eventual reality that odds favor them soon trading at a discount (although admittedly, not fully). Parwada, Siaw (2014) show that, in fact, when reviewing CEF investor holdings, investors otherwise do have less exposure to the assets in the CEFs they’re invested in.
Manager Ability Tradeoff with Fees
Another explanation for the observable facts is that CEF investors are willing to pay premiums and sell at discounts to reflect perceived manager ability and the cost of their services in the form of fees. Berk, Stanton (2007) argue that in equilibrium, most investors will not want to pay the high fees without a history of strong performance and so in general, CEFs will trade at a discount. Perceived ability is highest when launching an IPO. In general, though, mediocre performance leads on average to a discount. This theory also better explains the observation that at any given time, various CEFs trade at premiums while others trade at discounts.
Rent-Extraction
Of course, the simplest theory may be that CFE’s are simply rent-extraction tools used by fund sponsors against naive investors. If that is the case, activists should be able to capture some of those rents. And they do as Bradley, Brav, Jiang, Goldstein (2010) discuss. Activists have used the SEC’s proxy reforms in 1992 to both significantly increase their activities and reduce the discount level. Likewise, Chu and Ma (2015) show that the SEC’s 2004 Regulation SHO which relaxed short sale constraints, also has systematically shrunk the discount in the most affected CEFs.
What is happening beyond the ivory towers of academia?
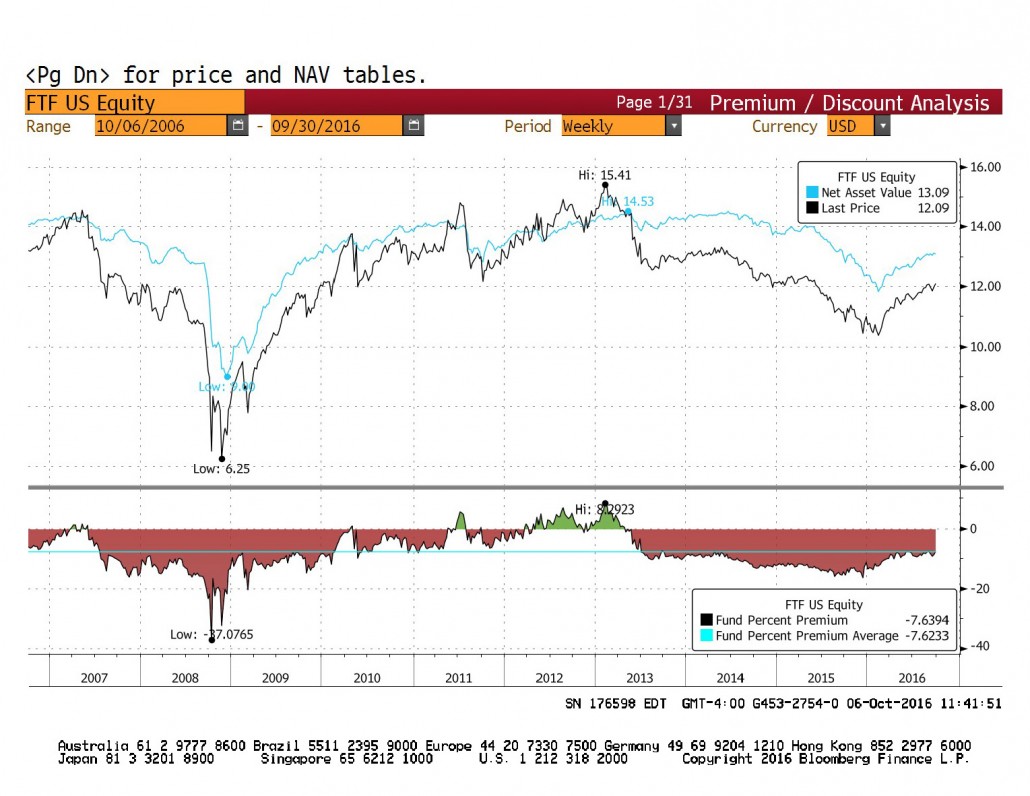
Investors now have a myriad of alternative ETFs to choose from, even in what are deemed less liquid markets, including leveraged loans, emerging markets, and high yield bonds. It’s harder to argue CEFs provide unique needed liquidity to retail investors. Still, the CEF anomaly appears alive and well — see below for a live example.
Although this illustrates only one CEF, FTF, many others follow a similar pattern.
Second, throughout this time, fund sponsors like Pimco have often traded at a premium whereas other funds sponsors like BlackRock have traded at more of a discount. In general, the sector has traded at an overall discount, which is consistent with trade-off between Manager Ability with Fees as predicted by the theory.
Finally, activists like Saba have been particularly active as reported in Barron’s this summer and as many investors have seen by the proxy letters like the one we received from Franklin Templeton regarding FTF. Arguably, their activity is partly responsible for the sectors strong performance so far in 2016.
Conclusions Regarding Closed End Funds
As with most strategies that seek to outperform, operating in the closed end fund sector involves a high level of risk. For example, the leveraged nature of many of these vehicles by definition increases risk. Although economic leverage in the form of debt is limited to 50% of assets, leverage from repo is separate and is legally unrestrained (although most still voluntarily cap their leverage at 50%). Leverage exposes investors not only to higher volatility, but also to forced deleveraging.
DWS RREF Real Estate Fund II Inc <SRO> is one example where caution was warranted. The fund invested mainly in REITs, omitted it’s dividend during the 2008 and liquidated in 2010 at roughly $1.15 a share after having a Net Asset Value (NAV) as high as 13.30 per share in September of 2008. As of June 30th, 2008, they had borrowed $350mm via Preferred Stock allowing them to hold $830mm in assets, comfortably under their 50% test. Yet by December of 2008, the value of the assets had dropped to just over $78mm after the managers deleveraged in late November and December — a low point for REIT prices — and the fund was no doubt joined at the time by other leveraged players who also were deleveraging, thus exacerbating the problem. The 91% negative rate of return in SRO’s NAV over that period compares to a negative 35% return of the NAREIT Equity REIT Index.
Leverage also exposes CEFs’ ability to maintain payout ratios when short term rates rise and asset expected returns fall (e.g., a flatter yield curve). That certainly added to fears during the 2014 Taper Tantrum and are likely weighing down discounts currently.
Even for unleveraged funds, discounts tend to gap wider during periods of market stress (e.g., the financial crisis, the Taper Tantrum, and this winter’s sell off). As is true with any strategy that relies on reversion to the mean, what can look like a good deal today can get even better tomorrow and better still the day after. I experienced that the hard way in 2008, but not so much that I had to bail out on what became the ultimate opportunity (hopefully for a lifetime as I don’t want to live through what it took to get there ever again).
So where does this leave investors? Let’s start with a few truisms:
- Don’t buy a Closed End Fund via an IPO unless you can’t access either the collateral or manager any other way. Wait until it starts trading at a discount as almost all of them eventually do.
- Discounts matter, so don’t ever pay a premium for a closed-end fund unless you’re sure you can’t invest in the asset elsewhere. Likewise, superior manager ability is very hard to predict and past performance is not a good guide (that’s another blog post) so among funds, choose the fund trading at the wider discount, everything else being equal.
- I know, everything is seldom equal. First and foremost, pay close attention to the fees. Fees have historically and will continue to drive relative performance. Irritatingly, though, the reporting of fees varies so make sure you are comparing apples to apples: use fees net of interest from leverage (or if you prefer, add it back) and recognize (and perhaps adjust for) that most fees are based on gross assets but reported as a percent of net assets.
- Try and ride the coattails of activist investors. You can increase your odds by monitoring turnover, dispersion of shareholders (or a proxy, the average size of trades), board structure, and the percentage of institutional ownership. But buy far the biggest driver attracting shareholders, as documented by Pontiff (1995) , is the size of the discount.
- Don’t get lulled into the reported yields. Many, if not most, support their yields by a combination of net interest, return of capital and capital gains.
Finally, and this is a maxim for all investing, know what you don’t know. CEFs, especially those within the fixed income space, tend to invest in very illiquid, often hard to value assets. Don’t get lulled into looking at the annual reports or factsheets. They only provide a cursory peak under the covers. A BB rated, very highly leverage CLO, for instance, may be reported simply as a benign ABS security. Managers are motivated to support payouts and as such, they tend to invest in higher yield (read riskier) securities.
With that said, happy investing and if applicable, vote your shares based on the empirical evidence and facts, not rhetoric.
[Caveat: I once worked for Franklin Resources many year ago in a different area but left on good terms and have no reason to suspect that it’s not still a well managed and ethical firm.]About the Author: Jonathan Seed
—
Important Disclosures
For informational and educational purposes only and should not be construed as specific investment, accounting, legal, or tax advice. Certain information is deemed to be reliable, but its accuracy and completeness cannot be guaranteed. Third party information may become outdated or otherwise superseded without notice. Neither the Securities and Exchange Commission (SEC) nor any other federal or state agency has approved, determined the accuracy, or confirmed the adequacy of this article.
The views and opinions expressed herein are those of the author and do not necessarily reflect the views of Alpha Architect, its affiliates or its employees. Our full disclosures are available here. Definitions of common statistics used in our analysis are available here (towards the bottom).
Join thousands of other readers and subscribe to our blog.


