Time for a little myth busting.
Recently, the Motley Fool posted an article that argued the following: when market volatility is low, protective put options are cheap.
From the article:
Smart investors know that the time to buy most investments is when most investors aren’t paying attention to them. The same is true of options. Typically, put options are cheapest during big bull markets, especially when major market benchmarks are climbing strongly. That’s because options traders don’t value protection highly when the market has upward momentum…Therefore, if you think about protective puts when it seems like you don’t really need them, then you’ll put yourself in the best position to pick them up cheaply.
In the current market environment, investors are understandably worried about tail risk. Overall asset valuations are high, uncertainly is elevated, and markets have been generally stable for a long time.
Investors worried about the prospect of a big market drawdown often look for portfolio insurance for protection. The best sort of insurance is cheap insurance. We’ve written on a few ways to buy insurance on the cheap. For example, we wrote here about how US Treasury Bonds, Hedge Fund Factors, and Managed Futures tend to go up when markets go down, thus providing insurance-like protection, in expectation. The benefit of these insurance programs is they tend to have positive carry, however — and this is a big “however” — these “crisis alpha” concepts aren’t guaranteed to provide downside protection when the world blows up in the future. The only pure equity market insurance asset is buying puts on equity markets, which will mechanically protect the downside if equity markets explode. But the downside of buying puts is they come at a cost, in form of an option premium.
Understanding Protective Puts
Long put options also go up in value when the underlying goes down, and so seem like a reasonable insurance asset candidate, although you don’t get paid to hold them as with the instruments above; instead they come at a cost.
So how much are we paying for this insurance?
If we are focused on cost, perhaps put options are a better bargain at some times when compared with other times? We wrote here about a paper that argued that as disaster risk increases, demand for put insurance skyrockets, but market makers become constrained from writing puts, making them expensive.
What about when markets are calm? Perhaps during such times put options are cheap?
So it would seem that put insurance is indeed cheap in calmer markets. It’s a great story, but is it borne out by the evidence?
In “Still Not Cheap: Portfolio Protection in Calm Markets,” by Roni Israelov and Lars Nielsen, the authors argue this is an overly simplistic view. What matters for assessing whether an option is expensive or cheap is not whether implied volatility is low relative to its history. The only thing that matters is the option’s price relative to its fundamentals — the difference between the options implied volatility and its realized volatility.
A Word on the Volatility Index, or “VIX”
Before we continue, let’s quickly review the VIX. For any option, given a price for the underlying, strike price and time to expiration, you can use the Black-Scholes formula to solve for its implied volatility, or what market expectations are for future volatility until expiration. VIX aggregates the implied 30-day volatilities for an average of weighted prices of S&P 500 equity options over a range of strike prices. The VIX is effectively the market’s overall volatility forecast for the next 30 days.
The Volatility Risk Premium
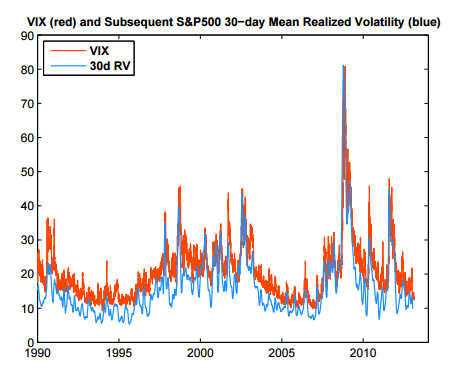
But as we know, forecasts can be wrong. And as it turns out, the VIX forecast is consistently wrong – and in one direction. When you compare VIX implied volatility forecasts to realized volatility, a distinct pattern emerges. The below chart from the paper, “Easy Volatility Investing,” by Tony Cooper, illustrates what happens:
The results are hypothetical results and are NOT an indicator of future results and do NOT represent returns that any investor actually attained. Indexes are unmanaged, do not reflect management or trading fees, and one cannot invest directly in an index. Additional information regarding the construction of these results is available upon request.
The red line is the VIX implied volatility prediction for future volatility, and the blue line is the volatility that was actually realized subsequent to that measurement.
What do you notice?
In general, VIX predictions for future realized volatility tend to be too high. As you can see, there is a consistent spread, representing the Volatility Risk Premium (VRP).
And the VRP spread is not insignificant. The Israelov and Nielson paper observes that from 1990 through 2014, the VRP averaged 3.4%, and was positive 88% of the time. That’s not only weird, but also has significant implications for strategies that use options.
Why Does the VRP Exist?
The authors suggest that because market makers cannot perfectly hedge their books, they require compensation for this additional risk. As Garleanu et al. argue, “…demand pressure in one option contract increases its price by an amount proportional to the variance of the unhedgeable part of the option.”
What is the True Cost of Being Long Volatility?
Okay, so we know buying the put option is essentially a long bet on volatility. How much are we paying for this bet? We can isolate this cost through the following exercise.
Being long equity and holding a protective put option is equivalent to three separate allocations: 1) long passive equity, plus 2) long volatility, plus 3) dynamic equity.
In order to break position performance into these 3 pieces, we split them as follows:
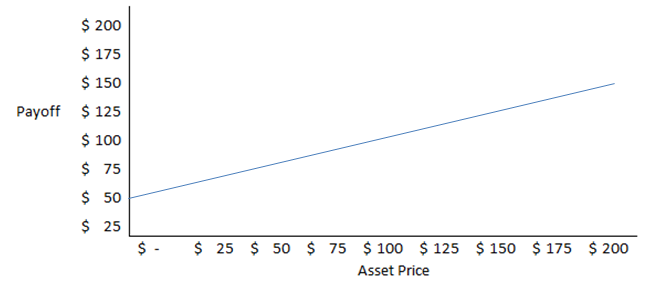
1. S&P 500 Exposure (Static): The portfolio below owns $50 of equity and $50 of cash. This is the long-term strategic equity allocation.
Long Half Equity + Long Half Cash:
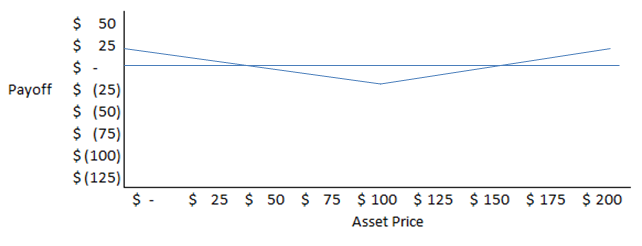
2. Long Volatility Exposure: The portfolio below is long a $25 at-the-money put option, long $50 of equity, and holds $50 of cash to finance the equity position. This is the long-term strategic long volatility allocation.
Long Put Option + Long Half Equity + Short Half Cash:
3. S&P 500 Exposure (Dynamic): The third piece relates to the put option’s time-varying equity exposure. We know that when we are far away from expiration, the option is not very sensitive to changes in the underlying. But as we get closer to expiration the option becomes more sensitive to changes in the underlying. Put another way, the option’s delta varies with the passage of time; it increases as we get closer to expiration. The passage of time results in greater exposure to equity risk. Note that we can recreate this exposure dynamically without using options.
Three Components of Protective Put Strategy
Below are summary statistics (1996-2014) for a protective put strategy, broken down into the three components described above:

The results are hypothetical results and are NOT an indicator of future results and do NOT represent returns that any investor actually attained. Indexes are unmanaged, do not reflect management or trading fees, and one cannot invest directly in an index. Additional information regarding the construction of these results is available upon request.
Let’s examine returns associated with the 3 components.
Passive equity: 5.2% excess returns
Dynamic equity exposure: excess returns are not statistically significant, but it offers a reduction in downside beta (-0.28). The Efficient Market Hypothesis suggests these returns should be zero.
Long vol exposure: Downside beta is reduced by 0.10, but this is achieved at a high cost: Performance is reduced by 2.0% per year.
Note that you could also achieve this downside reduction by selling 10% of the equity position. If expected returns are, say, 6%, than performance would be reduced by 0.6%.
This is remarkable. Why should you pay a 2% fee to maintain a long vol position, which doesn’t really offer much in the way of protection? It appears that, on average, long volatility exposure is very costly, compared with the meager benefits associated with it.
Volatility Regimes
But as discussed earlier, perhaps this insurance is less costly in calm markets?
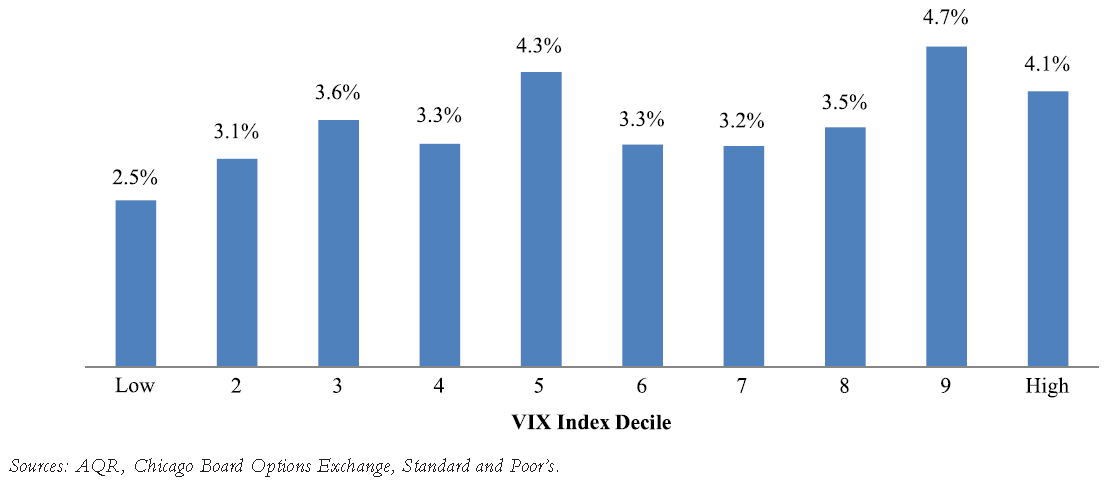
Below is a chart of the realized VRP (VIX Index minus the S&P 500 Index’s realized volatility) after sorting by the VIX at the beginning of each volatility regime:
The results are hypothetical results and are NOT an indicator of future results and do NOT represent returns that any investor actually attained. Indexes are unmanaged, do not reflect management or trading fees, and one cannot invest directly in an index. Additional information regarding the construction of these results is available upon request.
Although it does appear that the VRP is generally higher in higher volatility regimes, the lowest three buckets average 3.1%, which is not very different from the 3.4% average across all buckets. Even in the cheapest VIX bucket, expected returns from a long volatility position are still significantly negative.
When Do Protective Puts Pay Off?
But maybe there are times when put options in calm markets really pay off? Nope.
The chart below shows the minimum and maximum 21-day returns (80% confidence interval) of 95% out-of-the-money puts with delta hedging:
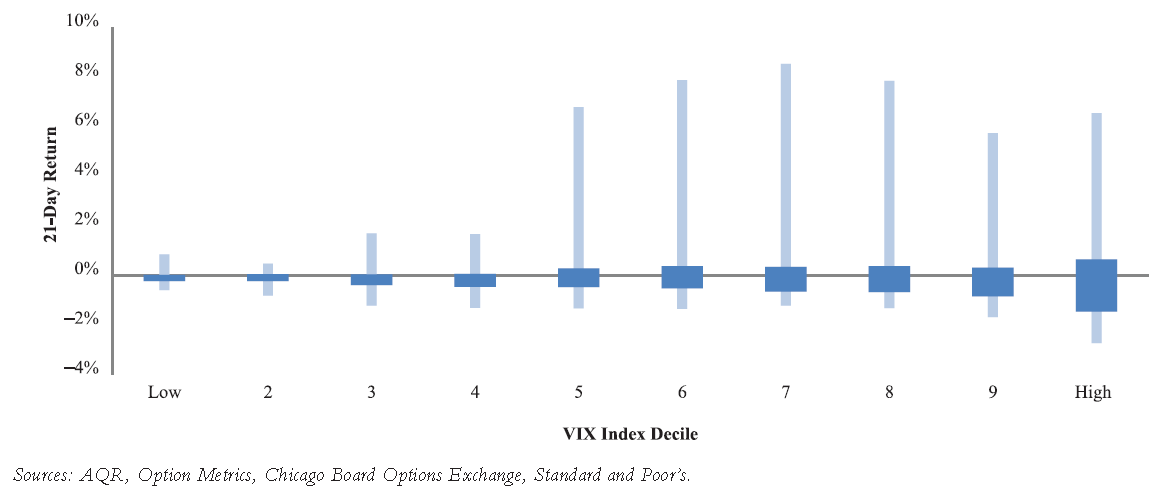
The results are hypothetical results and are NOT an indicator of future results and do NOT represent returns that any investor actually attained. Indexes are unmanaged, do not reflect management or trading fees, and one cannot invest directly in an index. Additional information regarding the construction of these results is available upon request.
The maximum 21-day return in the lowest four deciles is 1.7%. The real payoffs don’t seem to occur until we get into much more volatile markets.
Conclusions
The authors present more evidence from global markets and look at black swan scenarios. They conclude that in these cases as well, the VRP is positive in low volatility environments, and it is a costly bet to go long volatility even if the world does blow up. They replicate the 1987 crash, when markets dropped 20% in a day, and implied volatility spiked to 150%. In the low volatility decile, in order to break even on a protective put strategy with 5% out-of-the-money options, a 1987-type black swan would have to occur every 21 years.
Is this reasonable? The crash of 1987 was the worst daily crash for the S&P 500 going back to 1950, and when the 1987 crash occurred, the VIX was in the 7th decile (not in a low, calmer decile).
The authors suggest that if people have a strong view on an imminent market correction that they implement that view by reducing equity exposure, or by purchasing insurance assets that pay you to hold them. Accordingly, paying through the nose for a option-based hedging program that loses money for years while waiting for a big payoff that may never materialize is not the way to go.
Still Not Cheap: Portfolio Protection in Calm Markets
- Israelov and Nielsen
- A version of the paper can be found here.
- Want a summary of academic papers with alpha? Check out our Academic Research Recap Category.
Abstract:
Recent equity volatility is near all-time lows. Option prices are also low. Many analysts suggest this represents a good opportunity to purchase put options for portfolio insurance.
It is well-known that portfolio insurance is expensive on average, but what about in calm markets? History suggests it still is. We investigate the relationship between option richness and volatility across ten global equity indices. Option prices may be low, but their expected values tend to be even lower.
About the Author: David Foulke
—
Important Disclosures
For informational and educational purposes only and should not be construed as specific investment, accounting, legal, or tax advice. Certain information is deemed to be reliable, but its accuracy and completeness cannot be guaranteed. Third party information may become outdated or otherwise superseded without notice. Neither the Securities and Exchange Commission (SEC) nor any other federal or state agency has approved, determined the accuracy, or confirmed the adequacy of this article.
The views and opinions expressed herein are those of the author and do not necessarily reflect the views of Alpha Architect, its affiliates or its employees. Our full disclosures are available here. Definitions of common statistics used in our analysis are available here (towards the bottom).
Join thousands of other readers and subscribe to our blog.


