Short Interest and Lottery Stocks
- Kelley Bergsma & Jitendra Tayal
- A version of this paper can be found here
- Want to read our short summaries of academic finance papers? Check out our Academic Research Insight category.
What are the research questions
Using data from CRSP and Compustat from 1989 to 2015 the research team constructed portfolios based on lottery characteristics (example here) and analyze the impact of relative short interest (RSI = the total number of shorted shares/share outstanding) on returns. In looking at this data the authors are attempting to parse out more information on the specifics of the short interest anomaly and its interaction with lottery characteristics.
1. Is relative short interest mispricing greatest in lottery stocks, which retail investors flock towards and institutional investors by in large avoid?
2. Is the short interest anomaly concentrated in the lottery category where stocks are more costly to trade?
What are the Academic Insights?
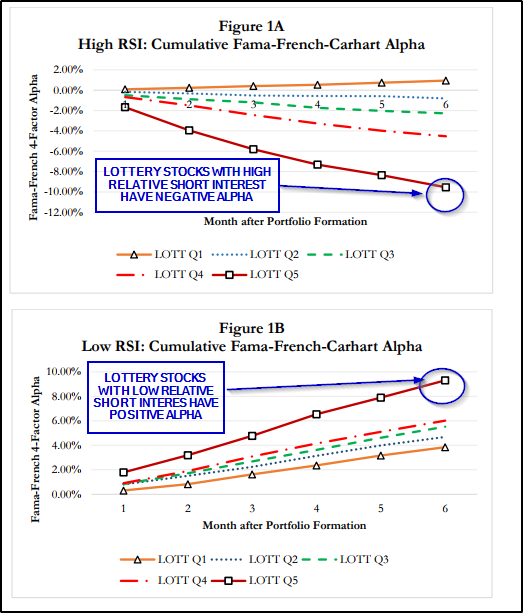
1. Yes – The authors find that the short interest anomaly is stronger in lottery stocks. Stocks with the most lottery-like features and high relative short interest had the largest negative alphas of -1.61% (T-score -3.64), and lottery-like stocks with low relative short interest had the largest positive alphas of 1.8% (T-score 5.99). The undervaluation of low relative short interest lottery stocks, as well as the overvaluation of high relative short interest stocks, persisted for 6 months. The most lottery-like stocks with high relative short interest showed a cumulative alpha of -9.55% over 6 months (Figure 1A), and the most lottery-like stocks with low relative short interest earned a cumulative alpha of 9.58% (Figure 1B) over the same time period.
2. MIXED. The data showed that higher transaction costs do impede arbitrage opportunities, particularly in the low relative short interest category. Market Cap in stocks with low relative short interest was highly correlated with increased lottery characteristics. In fact, the low relative short interest stocks with lottery characteristics had an average market cap of only $21 million. However, the same could not be said of lottery stocks with high relative short interest. In this category turnover and size were not limiting factors to arbitrage. The average firm in the most lottery-like category with high relative short interest had an average market cap size of $157 million. In the high relative short interest category, the most relevant factors for arbitrage was institutional ownership. Higher levels of institutional ownership led to more shares available to borrow.
Why does it matter?
This is one of the first studies to analyze the relationship of relative short interest on returns associated with the stocks exhibiting lottery characteristics. The finding that there is a segment of stocks with lottery characteristics that can drive positive alpha is a surprise because generically buying portfolios of lottery stocks has been a losing strategy, historically.
What is the most important chart from the paper?
The results are hypothetical results and are NOT an indicator of future results and do NOT represent returns that any investor actually attained. Indexes are unmanaged, do not reflect management or trading fees, and one cannot invest directly in an index. Additional information regarding the construction of these results is available upon request.
Abstract
We find that short interest-related mispricing is strongest among stocks with the most lottery-like characteristics, which are preferred by retail investors. Negative alphas for high relative short interest (RSI) stocks and positive alphas for low RSI stocks are monotonically related to stocks’ lottery features. Monthly portfolio alphas are –1.61% for stocks with high RSI and most lottery-like characteristics, while stocks with high RSI and the least lottery-like attributes show statistically insignificant alphas. Among lightly shorted stocks, lottery securities exhibit monthly alphas of 1.80%. Thus, although lottery stocks as a group typically underperform, investors can earn positive abnormal returns in lottery stocks with low RSI. Our results suggest that higher transactions costs among lottery stocks impedes arbitrage in short interest-related mispricing, particularly for low RSI stocks.

About the Author: Rich Shaner, CFA
—
Important Disclosures
For informational and educational purposes only and should not be construed as specific investment, accounting, legal, or tax advice. Certain information is deemed to be reliable, but its accuracy and completeness cannot be guaranteed. Third party information may become outdated or otherwise superseded without notice. Neither the Securities and Exchange Commission (SEC) nor any other federal or state agency has approved, determined the accuracy, or confirmed the adequacy of this article.
The views and opinions expressed herein are those of the author and do not necessarily reflect the views of Alpha Architect, its affiliates or its employees. Our full disclosures are available here. Definitions of common statistics used in our analysis are available here (towards the bottom).
Join thousands of other readers and subscribe to our blog.