Which Investment Factors Drive Corporate Bond Returns
- Turan G. Bali, Avanidhar Subrahmanyam, & Quan Wen
- A version of this paper can be found here.
- Want to read our summaries of academic finance papers? Check out our Academic Research Insight category.
What are the research questions
The presence of historical prices impacting future returns, i.e., momentum, has been well researched in the equity market, which we’ve covered here. We’ve also closely looked at momentum in bond markets here, here, and here.
What the Bali, Subrahmanyam, & Wen are exploring is whether momentum shows up in the corporate bond market, and if so where?
- Does the corporate bond market exhibit short-term reversals (STR) based on returns from t- 1 month, momentum (MOM) based on returns from t-12 to t-2, and/or long-term reversals (LTR) based on returns from t-48 to t-13?
- The research team developed a 4-factor model for estimating corporate bond returns utilizing beta to the bond market, STR, MOM, and LTR. Will this new 4-factor model outperform existing bond market factor models and equity-based factor models for explaining corporate bond returns?
- In a robustness test of STR, MOM, and LTR can we narrow down on what could potentially be an underlying source that is driving the factors.
What are the Academic Insights?
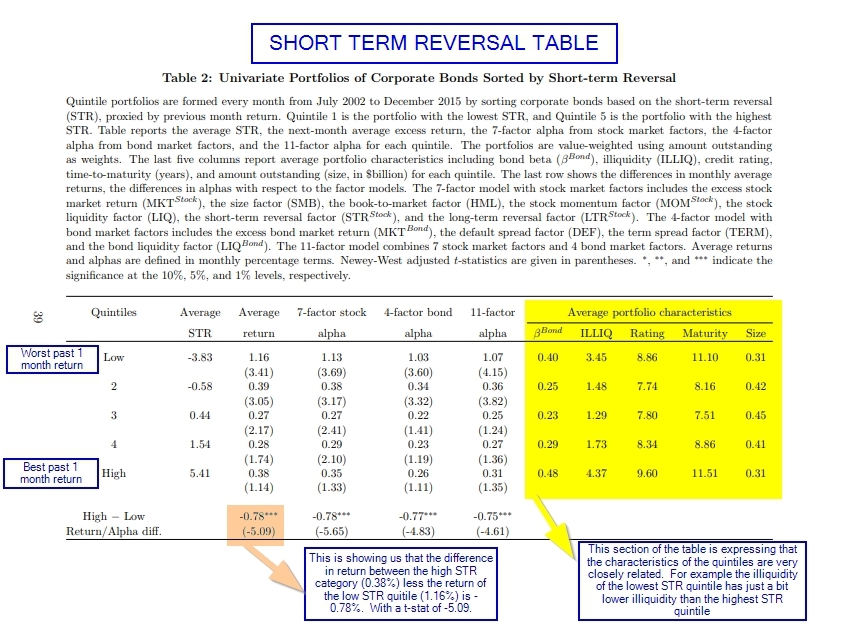
To do this research the team started by analyzing short-term reversals utilizing transactional data from Trade Reporting and Compliance Engine (TRACE). To observe the potential pattern of short-term reversals (STR) they broke the bond market down into quintiles based on the past 1-month return. The top returning bonds of the last month are placed into the highest quintile STR portfolio and the bonds with the worst returns over the prior month are in the lowest STR quintile portfolio. They then analyzed the data to see return differences between the high STR group and the low STR group. Analyzing this data in this way allowed the research team to identify whether there was a statistically significant difference in return characteristics between the quintiles. They then repeated this process to analyze medium-term momentum (MOM), and long-term reversals (LTR).
-
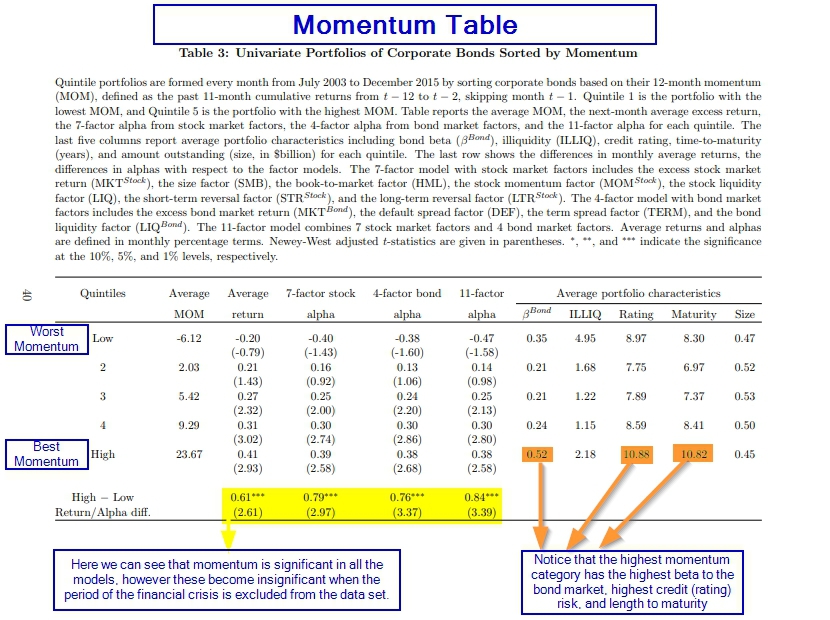
- Yes. When comparing the worst prior month return quintile with the best prior month return quintile it was found that the best prior month return quintile underperformed by an average difference of -0.78% per month (t-stat = -5.09). The monthly return difference between the best performing momentum (t-12 to t-2) quintile and the worst quintile showed that the corporate bonds with the highest momentum expressed excess monthly returns of 0.61% (t-stat = 3.39) when compared to the worst momentum quintile. Lastly, long-term winners (t-48 to t-13) underperformed the long-term losers by -0.66% per month (t-stat = -3.19).
- Yes, the 4-factor model that the research team proposes substantially outperforms a number of factor models considered in the literature in predicting the returns of the corporate bond market. The newly developed model had an average R2 = 0.43, while the best of the traditional bond factor models had an R2 = 0.22. This difference in R2 between the traditional factor models and the new 4-Factor model indicate the superior performance of the 4-factor model explaining returns in the portfolios of corporate bonds.
- Some of the most interesting conclusions of this paper came in the robustness tests finding the sources of STR, MOM, and LTR. When digging deeper into short-term reversals in the corporate bond market the researches found that STR disappears in the most liquid bonds and was strongest in the least liquid section of the bond market. This indicates that there is a liquidity-based explanation for short-term reversals. The researchers also found that the momentum effect was strongest in the highest default/credit risk bonds, while the factor becomes statistically insignificant in the lowest default/ credit risk section of the market. In addition to those findings, they also found that momentum is strongest in times of economic downturns and periods of high default risk. In fact, the impact of the financial crisis was so strong that when the financial crisis is excluded from the data the MOM factor becomes statistically insignificant. Much the same as momentum the long-term reversal factor was strongest in the highest credit risk and highest default risk bonds. In fact, the researchers found that credit rating downgrades are an important source of the long-term reversal effect.
Why does it matter?
Momentum has been well documented and investigated in the equity market, but the bond market has not been as thoroughly investigated for momentum factors. This paper focused on transactional data from the corporate bond market and found that short-term reversals, momentum, and long-term reversals were all present. With that said when the research dug deeper into the sources of the momentum factors in corporate bonds, they found interesting conclusions about what is driving each of these.
What are the most important charts from the paper?
The short-term reversal results:

The results are hypothetical results and are NOT an indicator of future results and do NOT represent returns that any investor actually attained. Indexes are unmanaged, do not reflect management or trading fees, and one cannot invest directly in an index.
The momentum results:

The results are hypothetical results and are NOT an indicator of future results and do NOT represent returns that any investor actually attained. Indexes are unmanaged, do not reflect management or trading fees, and one cannot invest directly in an index.
The long-term reversal results:

The results are hypothetical results and are NOT an indicator of future results and do NOT represent returns that any investor actually attained. Indexes are unmanaged, do not reflect management or trading fees, and one cannot invest directly in an index.
Abstract
The cross-section of corporate bond returns strongly depends on past bond returns. Comprehensive transaction-based bond data yield evidence of significant return reversals and momentum. Return-based factors for corporate bonds carry sizable premia and provide strong explanatory power for returns of industry- and size/rating/maturity-sorted bond portfolios. We also provide an illiquidity-based explanation of short-term reversal and show that momentum and long-term reversals are prevalent mainly in the high credit risk sector. Further, long-term reversals occur mainly in downgraded bonds (with low returns), indicating that downgrading increases the risk of holding the bonds, thus increasing the required return.
About the Author: Rich Shaner, CFA
—
Important Disclosures
For informational and educational purposes only and should not be construed as specific investment, accounting, legal, or tax advice. Certain information is deemed to be reliable, but its accuracy and completeness cannot be guaranteed. Third party information may become outdated or otherwise superseded without notice. Neither the Securities and Exchange Commission (SEC) nor any other federal or state agency has approved, determined the accuracy, or confirmed the adequacy of this article.
The views and opinions expressed herein are those of the author and do not necessarily reflect the views of Alpha Architect, its affiliates or its employees. Our full disclosures are available here. Definitions of common statistics used in our analysis are available here (towards the bottom).
Join thousands of other readers and subscribe to our blog.

