The Cash Conversion Cycle Spread
- Baolian Wang
- JFE, forthcoming.
- A version of this paper can be found here.
- Old discussions here and here. h.t. M. Mauboussin
What are the research questions?
The barrier to entry into the factor zoo has increased exponentially. Prof. Harvey (now working with RAFI) made this clear at the 2017 AFA address, when he highlighted the issue with data-mining in front of a room full of academics from top-flight research programs in the country. Prof. Harvey and his colleague Yan Liu go a bit further in their recent working paper, stating the following:
The rate of factor production in the academic research is out of control. We document over 400 factors published in top journals. Surely, many of them are false.
Lu Zhang and his colleagues pile on in their paper, “Replicating Anomalies,” which highlighted that a significant chunk of financial research papers cannot be replicated in their experimental setting.
Why mention all of this? Well, editors of academic journals have taken note, which means that the ability to get new “factor anomaly” papers published in the top tier journals has increased significantly. So when a new factor paper hits the best journals, we dive in and explore. In this paper, the author explores the use of cash conversion cycle (CCC), or the time it takes to turn sell inventory and collect receivables less the time it takes to pay the firm’s payables. In short, what’s the time span between spending cash and receiving cash.
The authors seeks to address the following questions:
- Does CCC, or cash conversion cycle, predict returns?
- Why does CCC earn abnormal returns?
What are the Academic Insights?
- YES. The predictive power is strong. The excess returns are robust to numerous asset pricing models, hold up over different subperiods, and work across all size quintiles.
- Mispricing. Risk-based models cannot account for the excess premiums, nor is here a relationship between financial intermediaries providing leverage and excess returns. The last remaining explanation — mispricing — prevails. Investors seem to suffer from systematic expectation errors and expected returns are higher among stocks with more costly arbitrage.
Why does it matter?
Cash conversion cycle is used frequently inside firms to assess a firm’s management effectiveness and to understand a firm’s external financing requirements. However, the measure has not been studied as an asset pricing tool until now.
The biggest issue with the finding is the fact that it is relatively easy to implement and most of the excess return is associated with mispricing. One would think that “now that the cat is out of the bag” investors may incorporate CCC into their models and arbitrage the anomaly away. Of course, this assumes that it is costly to arbitrage, which we know from some preliminary results in the paper, are non-negative. We would also like to see some additional tests done in international markets to see if the findings are robust.
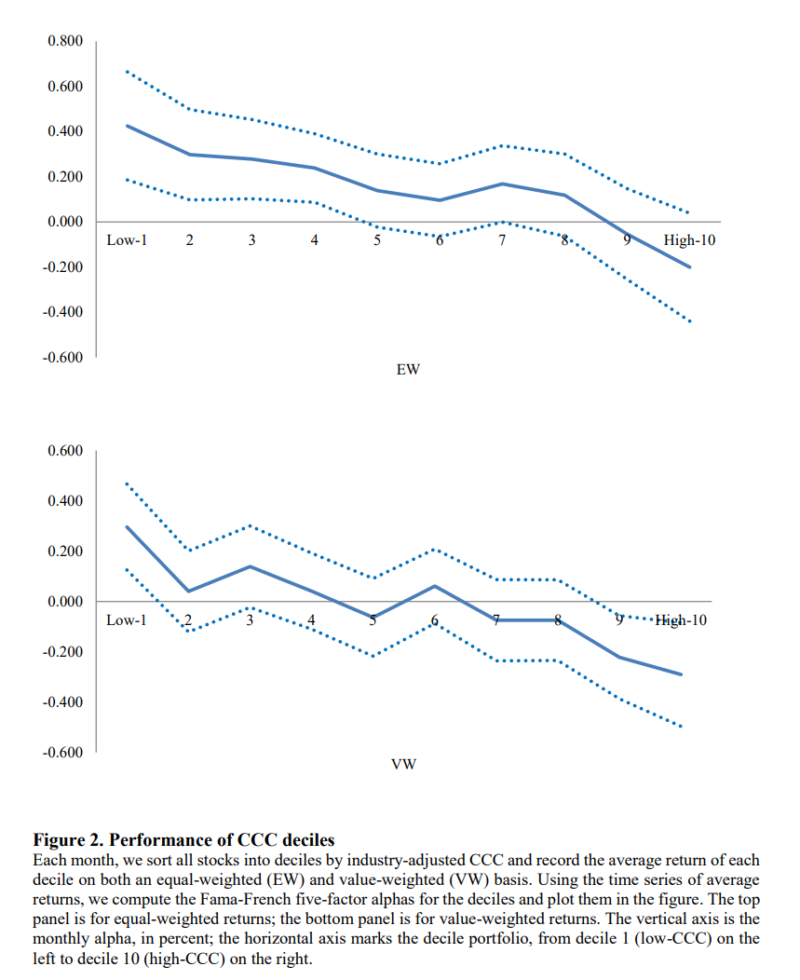
The most important chart from the paper

Abstract
The cash conversion cycle (CCC) refers to the time span between the outlay of cash for purchases to the receipt of cash from sales. It is a widely used metric to gauge the effectiveness of a firm’s management and intrinsic need for external financing. This paper shows that a zero-investment portfolio that buys stocks in the lowest CCC decile and shorts stocks in the highest CCC decile earns 5 to 7% alphas per year. The CCC effect is prevalent across industries and remains even for large capitalization stocks. The CCC effect is distinct from the known return predictors. The returns of high-CCC stocks are more sensitive to the health of the financial intermediaries than low-CCC stocks. This suggests that the CCC-based strategy cannot be explained by the financial intermediary leverage risk.
About the Author: Wesley Gray, PhD
—
Important Disclosures
For informational and educational purposes only and should not be construed as specific investment, accounting, legal, or tax advice. Certain information is deemed to be reliable, but its accuracy and completeness cannot be guaranteed. Third party information may become outdated or otherwise superseded without notice. Neither the Securities and Exchange Commission (SEC) nor any other federal or state agency has approved, determined the accuracy, or confirmed the adequacy of this article.
The views and opinions expressed herein are those of the author and do not necessarily reflect the views of Alpha Architect, its affiliates or its employees. Our full disclosures are available here. Definitions of common statistics used in our analysis are available here (towards the bottom).
Join thousands of other readers and subscribe to our blog.

