Researchers love novel datasets–it gives them a new set of information to conduct studies and test theories.
That brings us to this paper, titled “Core Earnings: New Data and Evidence” by Ethan Rouen, Eric So, and Charles C.Y. Wang. The paper uses a novel database created by our friends at NewConstructs.
What is new in this database? Essentially, the database attempts to adjust a firm’s GAAP reported earnings into what the paper calls “Core Earnings”. This is done by adjusting for expenses and revenues that are deemed to be non-recurring.
So what is the impact?
The authors find that the “core earnings” value is more persistent than the GAAP reported earnings value. In addition, they examine a trading strategy going long firms whereby the GAAP earnings are likely understated, and going short firms whereby the GAAP earnings is likely overstated. This portfolio earns a 5-factor alpha of 7-10% per year.
Below we dig into the paper!
Overview of the New Data
How exactly is the new database constructed?
This is described below in the data section:
NCs’ data collection process consists of three steps. The initial step is an internal application that allows human analysts to quickly and easily locate, tag, and mark up all relevant quantitative data points from financial statements, footnotes, and the MD&A. This tool facilitates collection of information about every data point, including original text, data value, units, and specific location in the filing,” according to New Constructs. The second step is development of a taxonomy that assigns each collected quantitative number to the appropriate category (e.g., operating and recurring; financing ; non-recurring revenues and expenses) to facilitate computation of measures of core operating income. The last component is automation, via a machine-learning algorithm that parses the entire corporate filing (i.e., an algorithm that can read, locate, tag, extract, and categorize every data point). The fundamental idea is that “if a human expert parsed certain data points into the same bucket enough times, then the machine could take over,” according to New Constructs. Whenever the machine comes across an item that it has not seen before, like “fracking waste disposal charge,” a human analyst is notified and will manually tag, mark up, and classify the disclosure (e.g., as operating/recurring or non-operating/non-recurring). Over time, the choices made by analysts constitute an ever-growing training data set from which machines learn to improve their ability to parse 10-Ks. The result of this process is a database of fully parsed 10-Ks (and 10-Qs) from 1998 through the present, available through EDGAR. Core Earnings: New Data and Evidence
At a high-level, this is similar to adjustments that fundamental analysts may make after thorough research on a specific company or industry. The difference is that these adjustments are driven systematically through machine learning (with some human involvement) and is done for a large sample of firms.
How large of a sample?
The data covers all firms listed in the Russell 3000 index from 1998-2017, covering around 60,000 firm-year observations.
Once again, the goal of the database is to adjust GAAP net income into what is deemed to be Core Earnings.
How is this done?
This is summarized below:
Specifically, Core Earnings adds back to GAAP net income the non-core net expenses related to (1) acquisitions, (2) currency devaluations or revaluations, (3) discontinued operations, (4) legal or regulatory events, (5) pension adjustments, (6) restructuring, (7) gains and losses that companies disclose as “other,” and (8) other unclassified gains and losses that NC deems non-operating. Core Earnings: New Data and Evidence
Thus, Core Earnings is constructed as below:
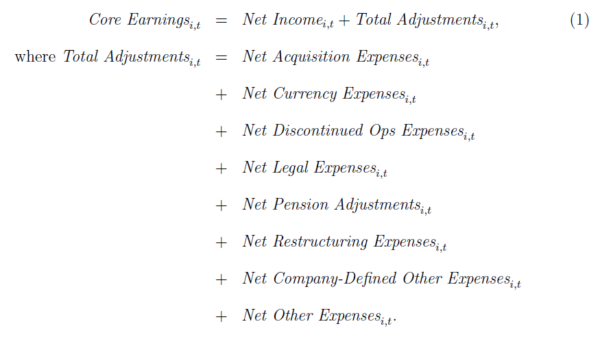
What are some examples of adjustments? One example of a “Net Acquisition Expense” is Yahoo’s net gain of $4.4bn from its sale of Alibaba stock in 2012. An example of a “Net Pension Adjustment” is a $2bn net gain in 2016 to Johnson & Johnson’s Net Income. Additional examples are given in the paper and in Appendix Table A.1.
Thus, the adjustments can be large at times.
But how often do adjustments occur and how large are they relative to the GAAP earnings?
Good questions.
The details are given in Table 1 in the paper. However, the overall takeaway is better described in an image.
Figure 1, shown below, gives both (1) the number of adjustments and (2) the value of the adjustments.
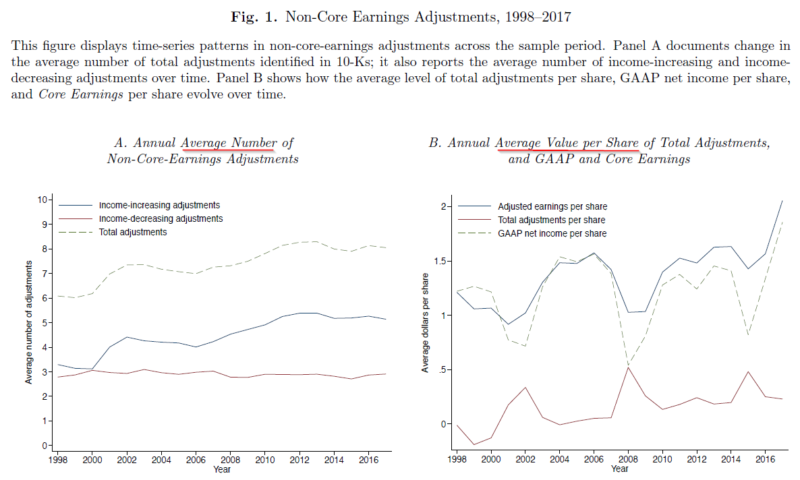
The results are hypothetical results and are NOT an indicator of future results and do NOT represent returns that any investor actually attained. Indexes are unmanaged and do not reflect management or trading fees, and one cannot invest directly in an index. Source: Core Earnings: New Data and Evidence
Figure 1, Panel A highlights the number of adjustments, both positive and negative, across time. As can be seen, the average number started around 6 per year in 1998 and ends near 8 per year in 2017. Figure 1, Panel B shows the average value per share of the adjustments, relative to the GAAP Earnings. As can be seen above, on average, GAAP earnings are below the “Core Earnings”, titled “Adjusted earnings per share” in the image above.(1)(2)
Great, so now that we have a better idea of how “Core Earnings” is constructed, can it increase the predictability of earnings and does the market price this in?
We examine this below.
Forecasting Properties of Core Earnings
Remembering that the main idea behind “Core Earnings” is to take out “one-off” expenses and income, one would hope that the “Core Earnings” variable is more persistent than GAAP earnings. Table 1, Panel E examines the firm-specific time-series AR(1) parameter for (1) GAAP Net Income and (2) Core Earnings.
The mean AR(1) coefficient for GAAP Net Income is 0.45, while the mean AR(1) coefficient for Core Earnings is 0.60, a 33% increase.(3)
The paper then examines the cross-sectional persistence of various earnings measures by regressing next year’s income on last year’s income. Income is measured in a few ways. The results are shown in Table 2, shown below.
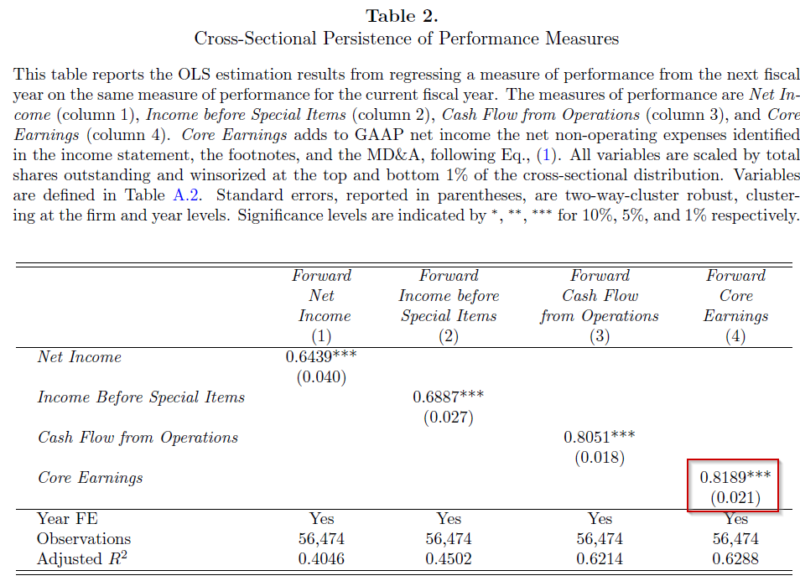
The results are hypothetical results and are NOT an indicator of future results and do NOT represent returns that any investor actually attained. Indexes are unmanaged and do not reflect management or trading fees, and one cannot invest directly in an index. Source: Core Earnings: New Data and Evidence.
As can be seen above, Table 2 highlights that Net Income has the lowest persistence of all the earnings measures, with a coefficient of 0.6439. Column 2 examines “Income Before Special Earnings” which tries to eliminate the influence of “special items” as identified by Compustat. As can be seen above, there is an increase in persistence (compared to Column 1) when using Compustat’s adjustments. However, those adjustments do not lead to as high of persistence compared to Core Earnings, which comes in with a coefficient of 0.8189. Thus, Core Earnings appears to have more persistence than other earnings measures.(4)
Table 3 finds that Core Earnings is incremental to predicting other measures of Income. In addition, the paper examines the relationship between Core Earnings and “Street Earnings”, which is a non-GAAP income measure created in IBES as another form of adjusted earnings. The results are found in Table 5, and highlight that Core Earnings give incremental information regarding future earnings.
Thus, the high-level takeaway should be the following–when attempting to predict future earnings numbers, Core Earnings has predictive ability above and beyond GAAP measures of earnings.(5)
Great!
But has the market already accounted for this?
In other words, have stock prices already been adjusted accordingly?
A simple way to examine this is to split the universe into deciles by the Total Adjustments divided by Total Assets.(6)
If the market already has this information embedded in prices, we would expect to see no difference in returns across the deciles. If, on the other hand, the market fails to account for these adjustments, one may expect the market to overvalue firms where the Core Earnings is lower than GAAP Earnings (i.e. GAAP Earnings is too high), and to undervalue firms where the Core Earnings is higher than the GAAP Earnings (i.e. GAAP Earnings is too low).
The results of this simple test are shown in Table 7 below.
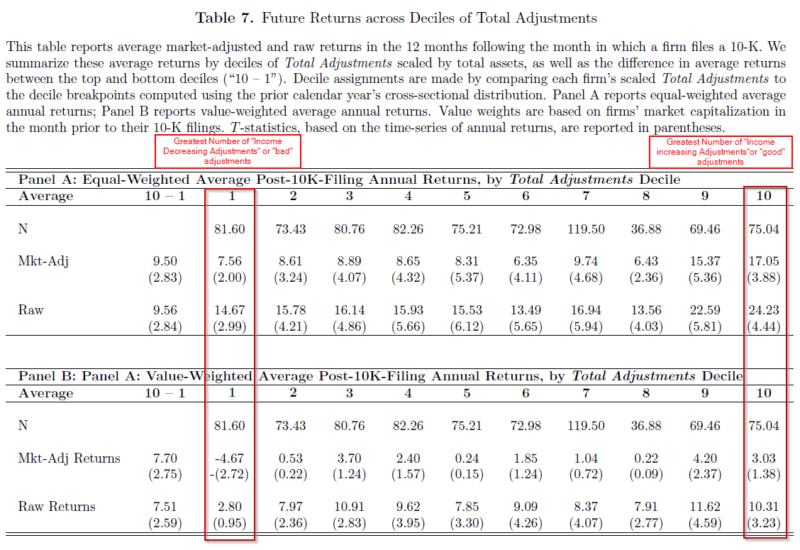
The results are hypothetical results and are NOT an indicator of future results and do NOT represent returns that any investor actually attained. Indexes are unmanaged and do not reflect management or trading fees, and one cannot invest directly in an index. Source: Core Earnings: New Data and Evidence
Column 1 above has the decile with the most “income decreasing” or “bad” adjustments, while Column 10 has the decile with the most “income increasing” or “good” adjustments. As can be seen in both Panel A (equal-weighted returns) and Panel B (value-weighted returns), in general, it appears that the market has not incorporated these adjustments into prices. The spread between the “good” and “bad” adjustment deciles is ~9.5% when equal-weighting and ~ 7.5% when value-weighting!(7)
Table 8 runs OLS regressions of next year’s returns on Total Adjustments, as well as other known variables such as each firm’s Size, Value, Quality, and Accrual measures, and finds that Total Adjustments has a positive and significant relationship between returns and adjustments. Thus, even accounting for other well-known variables, the Total Adjustments variable has predictive information for returns.
Last, the paper runs a time-series regression to account for the Market, Size (SMB), Value (HML), and Momentum (UMD) factors. The strategy is simply to go long decile 10 (most “good adjustments) and go short firms in Decile 1 (the most “bad” adjustments).
The results show that the monthly 4-factor alpha is 0.543 (0.653) for equal-weighted (value-weighted) portfolios–for an annual alpha of 6.7% (8.12%)!
Thus, it does not appear that the market fully embeds these adjustments into the prices.
Conclusion:
In summary, this paper examines a new dataset by NewConstructs. The database uses machine learning to adjust the firm’s GAAP earnings in an attempt to better measure the firm’s “Core Earnings.”
The main findings are listed below:
- A firm’s Core Earnings is more persistent than GAAP Earnings.
- If trying to predict future earnings, Core Earnings has predictive ability above and beyond GAAP earnings numbers.
- The market does not appear to account for these adjustments in the prices, as highlighted with the significant 4-factor Alpha (and raw returns).
Overall, this is an interesting paper highlighting a new dataset as well as a useful application of machine learning.
Core Earnings: New Data and Evidence
- Ethan Rouen, Eric So, and Charles C.Y. Wang
- A version of the paper can be found here
- A link to the data provider is found here
- Want to read our summaries of academic finance papers? Check out our Academic Research Insight category
Abstract:
Using a novel dataset that comprehensively classified the quantitative financial disclosures in firm’s 10-Ks, including those hidden in the footnotes and the MD&A, we show that disclosures of non-operating and less persistent income-statement items are both frequent and economically significant, and increasingly so over time. Adjusting GAAP earnings to exclude these items creates a measure of core earnings that is highly persistent and that forecasts future performance. Analysts and market participants are slow to impound the implications of transitory earnings. Trading strategies that exploit cross-sectional differences in firm’s transitory earnings produce abnormal returns of 7-to-10% per year.
References[+]
| ↑1 | The authors note this may be due to accounting conservatism. |
|---|---|
| ↑2 | Figure 2 examines what the authors deem to be “hidden adjustments”, which are those located in the footnotes or MD&A section of the 10-k. They find that hidden adjustments have risen over time (from 3.35 to 3.78) and that the hidden adjustments now are more likely to be negative than the beginning of the sample period. |
| ↑3 | Note that this is done only on firms with 15 years worth of information. |
| ↑4 | One can also see that Cash Flow from Operations has a high persistence. |
| ↑5 | As well as “Street Earnings.” |
| ↑6 | The scaling by total assets is done to account for firm size. |
| ↑7 | This is noted in the “10-1” column. |
About the Author: Jack Vogel, PhD
—
Important Disclosures
For informational and educational purposes only and should not be construed as specific investment, accounting, legal, or tax advice. Certain information is deemed to be reliable, but its accuracy and completeness cannot be guaranteed. Third party information may become outdated or otherwise superseded without notice. Neither the Securities and Exchange Commission (SEC) nor any other federal or state agency has approved, determined the accuracy, or confirmed the adequacy of this article.
The views and opinions expressed herein are those of the author and do not necessarily reflect the views of Alpha Architect, its affiliates or its employees. Our full disclosures are available here. Definitions of common statistics used in our analysis are available here (towards the bottom).
Join thousands of other readers and subscribe to our blog.