The positive trade-off between risk and expected return is the most fundamental concept in financial economics. Most investors are risk-averse. In order to hold higher-risk securities, they demand higher compensation in the form of higher expected returns. And risk-averse investors are more sensitive to downside risk, the left tail in the distribution of potential outcomes. I covered tail risk mitigation in a previous post titled: Volatility Expectations and Returns. The risk-averse investor theory would suggest that stocks with higher left-tail risk would be expected to have lower prices as compensation for the higher probability and magnitude of large losses associated with them. The result should be higher returns from stocks with higher left-tail risk.
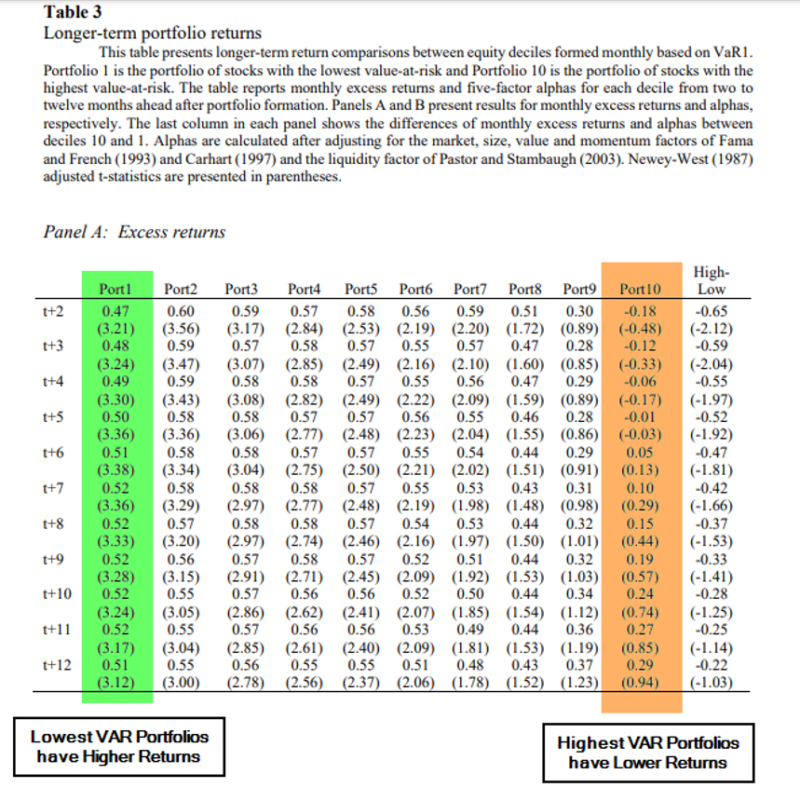
Yigit Atilgan, Turan G. Bali, K. Ozgur Demirtas, and A. Doruk Gunaydin tested this hypothesis in their study “Left-Tail Momentum: Underreaction to Bad News, Costly Arbitrage and Equity Returns,” published in the March 2020 issue of the Journal of Financial Economics. They estimated left-tail risk using two standard metrics; value-at-risk and expected shortfall which measure, respectively, a decrease in an asset’s value at a certain probability and the average magnitude of the losses conditional that the loss is lower than a certain threshold. Their data sample covered the period from 1962 to 2014.
Following is a summary of their findings:
- In contradiction with the expected positive risk/expected return trade-off, stocks with high (low) left-tail risk have low (high) future raw and risk-adjusted returns.
- Left-tail risk is a highly persistent equity characteristic that is underestimated by investors who overprice securities that experienced large losses recently and get negatively surprised when these large losses drift into the future—the left-tail risk anomaly is stronger for those equities that have experienced large daily losses recently. The anomaly is also strongest for those stocks with large daily losses both during the portfolio formation month and the preceding month, indicating that investors are overconfident in their consideration of the mean-reversion in left-tail risk.
- Smaller firms, stocks with higher market betas, higher downside betas, higher idiosyncratic volatilities, and stronger lottery-like features also have higher left-tail risk.
- The left-tail risk anomaly continues to persist after controlling for various firm characteristics and risk factors that are known to predict the cross-section of equity returns.
- The left-tail return momentum is not explained by long-established low-risk anomalies (i.e., the idiosyncratic volatility puzzle, betting-against-beta) or demand for lottery-like stocks.
- The abnormal return to the zero-cost portfolio (difference in returns between the highest and lowest decile stocks) is -0.94 percent per month with a t-stat of -4.42, which is both economically and statistically significant. This finding is driven by the underperformance of stocks with high left-tail risk since the alpha on decile 10 is significantly negative, whereas the alpha on decile 1 is economically and statistically insignificant.
- In an out-of-sample test, the results hold in international markets.
- Individual (institutional) investors are more (less) active in high left-tail risk stocks. Moreover, the magnitude of the left-tail risk anomaly or the underreaction to left-tail events is stronger for those equities with lower institutional ownership, providing a behavioral explanation for the anomaly. These results are also consistent with limits-to-arbitrage—left-tail momentum is more pronounced for stocks that are costlier to arbitrage.
- The results are also found in mutual funds—funds that experience more pronounced left-tail events have significantly lower abnormal returns in the future compared to funds that have lower value-at-risk.
These findings led the authors to conclude that left-tail risk is a highly persistent equity characteristic.
The tendency of large losses to persist into the future suggests the existence of a left-tail return momentum.
They argue:
Stocks with higher left-tail risk have experienced large losses during the recent period and investors underestimate the probability of these losses to persist. As a result, they end up paying high prices for such stocks and experience lower returns when the losses continue into the future. Stocks with high value-at-risk are more likely to have fallen in value since purchase and investors who refrain from realizing their losses could prefer to hold on to these stocks [the disposition effect at work]. Thus, the effect of recent crashes will not be fully reflected in equity prices resulting in left-tail momentum.
While it is not unusual to find behavioral biases negatively impacting retail investors (it’s why retail is considered “dumb” money), it was interesting to note the same phenomenon was found in mutual fund returns. It appears that at least some institutional fund managers are subject to the same biases. Investors and funds can benefit by screening out stocks with the negative characteristics identified in the study— smaller stocks with higher market betas, higher downside betas, higher idiosyncratic volatilities, and stronger lottery-like features, while also screening for negative momentum.

About the Author: Larry Swedroe
—
Important Disclosures
For informational and educational purposes only and should not be construed as specific investment, accounting, legal, or tax advice. Certain information is deemed to be reliable, but its accuracy and completeness cannot be guaranteed. Third party information may become outdated or otherwise superseded without notice. Neither the Securities and Exchange Commission (SEC) nor any other federal or state agency has approved, determined the accuracy, or confirmed the adequacy of this article.
The views and opinions expressed herein are those of the author and do not necessarily reflect the views of Alpha Architect, its affiliates or its employees. Our full disclosures are available here. Definitions of common statistics used in our analysis are available here (towards the bottom).
Join thousands of other readers and subscribe to our blog.