Since the development of the first asset pricing model, the Capital Asset Pricing Model (CAPM), academic research has attempted to develop models that increase the explanatory power of the cross-section of stock returns. We moved from the single-factor CAPM (market beta), to the three-factor Fama-French model (adding size and value), to the Carhart four-factor model (adding momentum), to Hou, Xue, and Zhang’s q-factor model (beta, size, investment, profitability), to the Fama-French five-factor (adding value to the q-factor model) and six-factor models (adding back value and momentum to the q-factor model). There have also been versions that use different metrics for profitability and investment, and Stambaugh and Yuan’s mispricing (anomaly)-based model. A deeper history of Factor Investing can be found here.
Think about it this way: Financial models aren’t cameras that provide us with a perfect picture of the way financial markets work. Instead, they are engines that advance our understanding of how markets operate and how prices are set—which is why we continue to see efforts to improve upon existing models.
Kewei Hou, Haitao Mo, Chen Xue, and Lu Zhang contribute to the asset pricing literature with their study “An Augmented q-Factor Model with Expected Growth,” published in the February 2021 issue of the Review of Finance. They began by noting:
“In the investment theory, firms with high expected investment growth should earn higher expected returns than firms with low expected investment growth, holding current investment and expected profitability constant. Intuitively, if expected investment is high next period, the present value of cash flows from next period onward must be high. Consisting primarily of the present value of cash flows from next period onward, the benefit of investment this period must also be high. As such, if expected investment is high next period relative to current investment, the discount rate must be high to offset the high benefit of investment this period to keep current investment low.”
To test this prediction, they performed cross-sectional forecasting regressions of expected growth, defined as expected investment-to-assets changes on current Tobin’s q, operating cash flows, and the change in return on equity. They measured current investment-to-assets as total assets from the most recent fiscal year ending at least four months earlier minus the total assets from one year prior, scaled by the one-year-prior total assets. They then augmented the q-factor model with their expected growth factor to form the q5 model and stress-tested it, and other leading factor models, against 150 documented anomalies with t-stats that were significant at the 5 percent level. Their data sample covered U.S. stocks for the period 1967-2018.
Following is a summary of their findings:
- High cash flows and high changes in return on equity strongly predicted high investment-to-assets changes, and high Tobin’s q weakly predicted low investment-to-assets changes—operating cash flows performed better than Tobin’s q.
- The expected one-year-ahead investment-to-assets changes closely tracked the average future realized one-year-ahead investment-to-assets changes at the portfolio level.
- An independent 2 × 3 sort on size and expected one-year-ahead investment-to-assets changes yielded an expected investment growth factor, with an average premium of 0.84% per month (t = 10.27). While the investment and return on equity factor loadings were both significantly positive, 0.21 and 0.3 (t = 4.86 and 9.13), respectively, they still left the bulk of the average return unexplained.
- The expected growth factor had positive correlations of 0.34 and 0.51 with the investment and ROE factors, but negative correlations of -0.46 and -0.37 with the market and size factors in the q-factor model.
- The q-factor model could not explain the growth factor premium, with an alpha of 0.67% (t = 9.75).
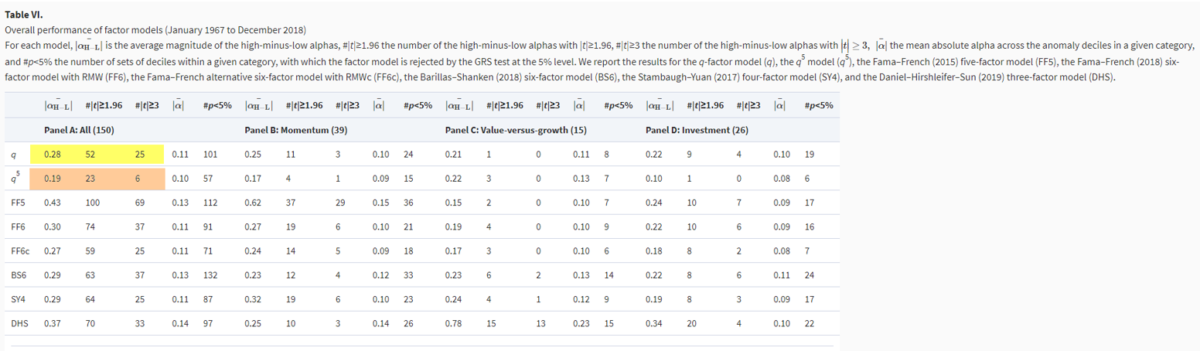
- Improving on the q-factor model substantially, the q5 model was the best performing model among all the factor models tested.
- Across the 150 anomalies, the average magnitude of the high-minus-low alphas was 0.19% per month, dropping from 0.28% in the q-factor model. The number of significant high-minus-low alphas was 23 in the q5 model (six with t-stats greater than 3), dropping from 52 in the q-factor model (25 with t-stats greater than 3).
- Their findings were robust to various tests.
Their findings led Hou, Mo, Xue, and Zhang to conclude:
“The expected growth factor represents a new dimension of the expected return variation that is largely missing from the q-factor model.”
They added:
“We bring expected growth to the fore of empirical finance. This extension resolves many empirical difficulties of the q-factor model, such as the anomalies based on R&D-to-market as well as operating and discretionary accruals. … By more than halving the number of anomalies unexplained by the q-factor model from 52 to 23, with only one extra factor, the q5 model makes further progress toward the goal of dimension reduction.” And finally, the q5 model “substantially outperforms the Fama-French six-factor model.”
As a further test of the robustness of their findings, it would be helpful to observe if the findings were similar in international markets. Hopefully, Hou, Mo, Xue, and Zhang will publish those findings in a follow-up study.
Summary
Through their research, financial economists continue to advance our understanding of how financial markets work and how prices are set. The Fama-French three-factor model was a significant improvement on the single-factor CAPM. Mark Carhart advanced our understanding by adding momentum as a fourth factor. And the authors of the q-theory made further significant advancements, which in turn motivated the development of the competing Fama-French five- and six-factor models. And now we have an improved q-factor model.
The competition to find superior models is what advances our understanding not only of the markets but also about which factors to focus on when selecting the most appropriate investment vehicles and developing portfolios.
Disclosure
The information presented herein is for educational purposes only and should not be construed as specific investment, accounting, legal, or tax advice. Certain information contained may be based on third party data which may become outdated or otherwise superseded without notice. Third party information is deemed to be reliable but its accuracy and completeness cannot be guaranteed. By clicking on any of the links above you acknowledge that they are solely at your convenience, and do not necessarily imply any affiliations, sponsorships, endorsements or representations whatsoever by Buckingham regarding third-party websites. Buckingham is not responsible for the content, availability, or privacy policies of these sites, and shall not be responsible or liable for any information opinions, advice, products or services available through them. The opinions expressed by the featured author are their own and may not accurately reflect those of Buckingham Strategic Wealth® or Buckingham Strategic Partners® (collectively Buckingham Wealth Partners, “Buckingham”). LSR-21-39

About the Author: Larry Swedroe
—
Important Disclosures
For informational and educational purposes only and should not be construed as specific investment, accounting, legal, or tax advice. Certain information is deemed to be reliable, but its accuracy and completeness cannot be guaranteed. Third party information may become outdated or otherwise superseded without notice. Neither the Securities and Exchange Commission (SEC) nor any other federal or state agency has approved, determined the accuracy, or confirmed the adequacy of this article.
The views and opinions expressed herein are those of the author and do not necessarily reflect the views of Alpha Architect, its affiliates or its employees. Our full disclosures are available here. Definitions of common statistics used in our analysis are available here (towards the bottom).
Join thousands of other readers and subscribe to our blog.