I examine the performance records of performance of Ben Graham’s well-known disciples: Walter Schloss, Tom Knapp, Warren Buffett, Bill Ruane, Charlie Munger, Rick Guerin, and Stan Perlmeter. The research question I seek to address is the following: Do the academic “value” and “quality” factors explain the performance of these legendary investors?
Surprisingly, the evidence suggests a weak relationship, at best, with academic value and quality factors.
Let’s dig in a bit more…
Traditionally, Benjamin Graham and his investment style are associated with the value factor, which is generally characterized by buying a portfolio of stocks based on some measure of price to fundamentals (i.e., price/earnings).(1). Graham’s investment style is less often associated with the quality factor, perhaps due to his popular “cigar butts” strategy, but the reality is that Graham was keen to understand not only the price of a business but also the quality of a business.(2). In fact, the quality factor proposed in “Quality Minus Junk” by Asness, Frazzini, and Pedersen (2019) is composed of the four “quality elements” of profitability, growth, stability, and payout that were proposed by Graham (1957) in “Two Illustrative Approaches to Formula Valuations of Common Stocks.” In summary, it would be fair to suggest that both the value and quality factors are grounded in ideas that were first formalized by Ben Graham. (Note: Alpha Architect has published information on Ben Graham’s strategies — most recently on Net-Net’s and backtesting of Ben Graham’s trading rules.)(3)Further elaboration on Graham’s association with value and quality is “Buffett’s Alpha,” a paper by Frazzini, Kabiller, and Pedersen (2018). They find the following:
“Buffett personalizes the success of value and quality investment, providing real-world out-of-sample evidence on the ideas of Graham and Dodd (1934).”
Although Buffett is certainly the most well-known of Graham’s disciples, studying a sample of one does little to provide evidence on the population of Graham’s disciples (unless the population is also equal to one). Therefore, in order to truly understand Graham’s investment style, a sample of more than just Buffett is needed. Luckily, Buffett himself provided a sample of Graham’s disciples in his now-famous “The Superinvestors of Graham-and-Doddsville.”
The super investors of Graham-and-Doddsville have been well known since 1984, and much has been written/commented on their success, but there appears to have been no attempt to utilize this group to better understand Graham’s investment style.
To quote Buffett (1984):
“Despite all the academic studies of the influence of such variables as price, volume, seasonality, capitalization size, etc., upon stock performance, no interest has been evidenced in studying the methods of this unusual concentration of value-oriented winners.”
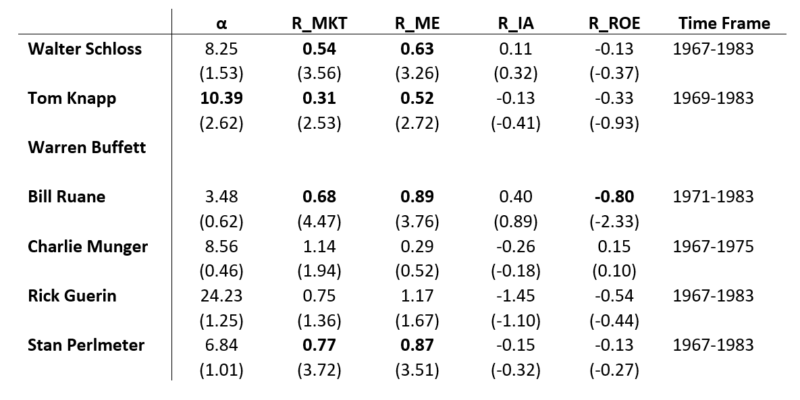
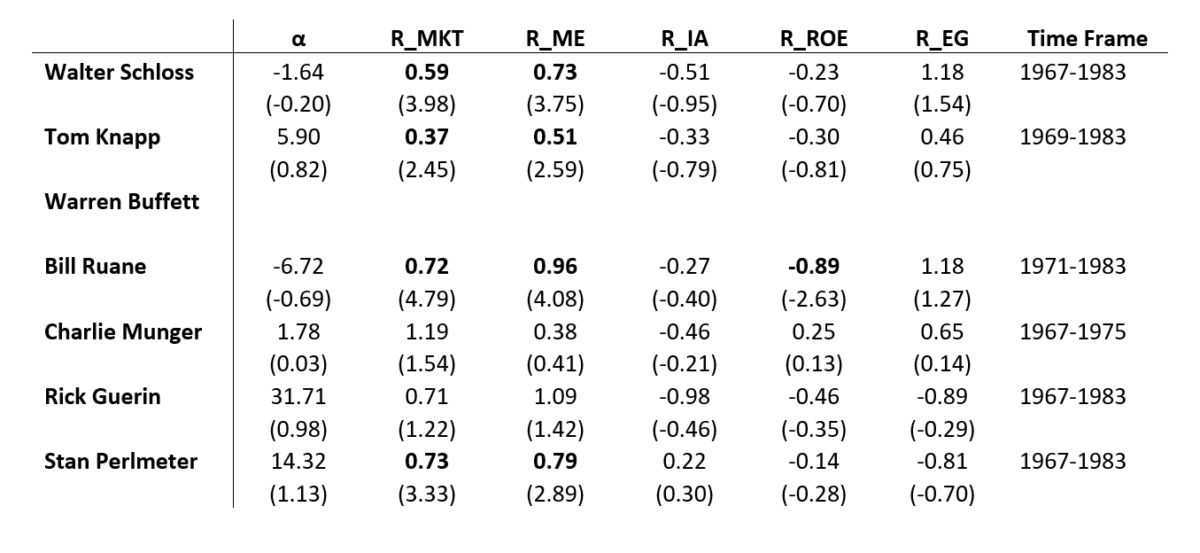
To better understand Graham’s investment style via his disciples, the study below decomposes the returns of the super investors of Graham-and-Doddsville via the six-factor model proposed by Frazzini et al. (2018) in order to determine which factors are associated with Graham’s investment style.(4) The Appendix attempts to add a degree of robustness by providing regression results for two additional asset pricing models that utilize a quality factor. Results are shown for the Fama-French (2015) five-factor model and the Hou, Xue, and Zhang q-factor models (both the original four-factor model (2015) as well as the five-factor version (2021)). Results for Buffett are not provided due to data insufficiency.
Beginning with univariate regressions, the table below reports R-squared for each factor. Based upon the coefficient of determination, the market and size factors stand out as very strong explanatory variables across the entire sample. In fact, with the exception of the quality factor’s incredibly strong explanatory power for Buffett, the lowest R-squared for the market and size factors is equal to the highest R-squared for any other factor. In contrast, the value factor is a very poor explanatory variable. Buffett is the only super investor to have more than 10% of the variation of his return history explained by the variation of the value factor. Similarly, the momentum factor is also a relatively poor explanatory variable; although, momentum does appear to have some explanatory power for Buffett, Ruane, and Munger. The low-risk and quality factors find themselves somewhere in the middle as they are generally better explanatory variables than the value and momentum factors but much less so than the market and size factors. Ultimately, univariate regressions provide practically no evidence to support the value factor’s association with Graham’s investment style as the value factor is by far the worst explanatory variable in the set based upon R-squared values. But these regressions do provide at least some support for the quality factor’s association, albeit much less so than for the market and size factors. Surprisingly, changing HML-D to the value factor of Fama and French (i.e., HML) or an earnings or cash flow-based value factor produces nearly identical results.

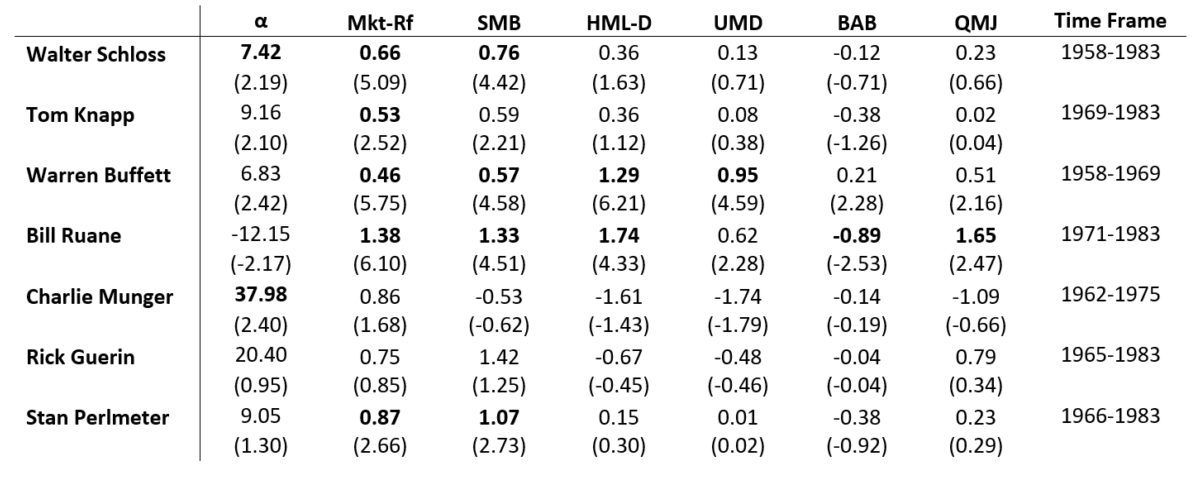
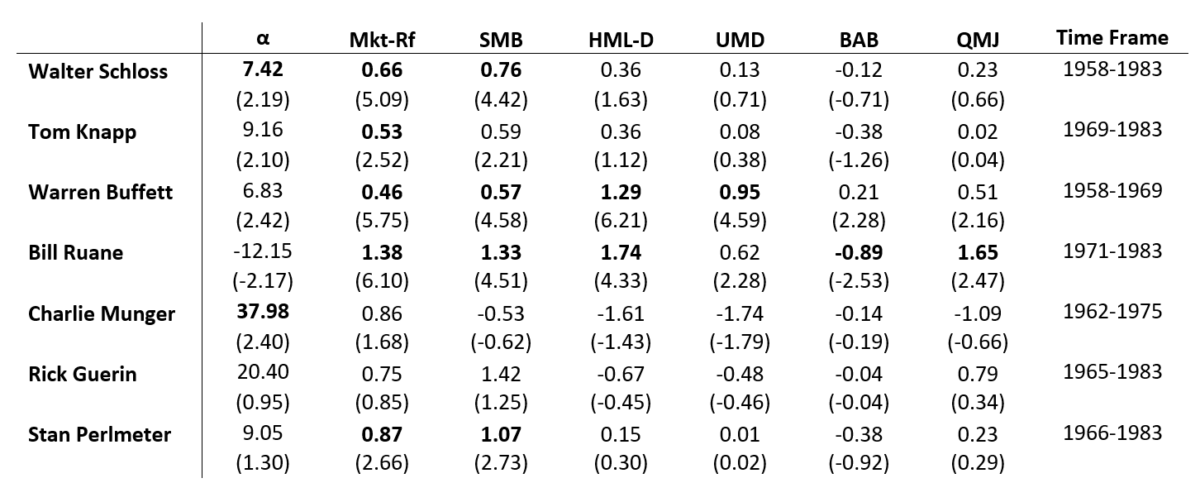
Shifting to multivariate regressions, the table below reports intercepts (alpha), loading coefficients, and t-stats for each super investor. The value factor continues to demonstrate its lack of association with Graham’s investment style and while the univariate regressions offered promise for the quality factor, the multivariate regressions document the factor’s lack of significance as it generally becomes subsumed within the six-factor model. Only two of the seven super investors produce statistically significant (5%) loadings on the value factor and only one produces a statistically significant loading on the quality factor. Similarly, only one of the seven produces a statistically significant loading on the momentum and low-risk factors. In comparison, five and four of the seven produce statistically significant loadings on the market and size factors, respectively. Ultimately, multivariate regressions provide little evidence to support the value and quality factors’ association with Graham’s investment style. Value and quality are certainly helpful in explaining the performance of Buffett and Ruane, but across the sample, it is again the market and size factors that are most significant. In addition, these regressions provide out-of-sample support for Frazzini et al. (2018) as the six-factor model is indeed a workhorse model for Buffett (and possibly Ruane as well).

Based upon the most representative sample of Graham style investors available, and contrary to what is traditionally thought and “known” about Graham’s investment style, value and quality do not appear to be synonymous with his approach. Univariate regressions provide little support for the value factor’s association with Graham’s investment style but there does appear to be some evidence to support the quality factor’s association. In contrast, univariate regressions offer highly compelling evidence to support the significance of the market and size factors’ association with Graham’s investment style. Multivariate regressions also provide little evidence to support either the value factor or the quality factor’s association with Graham’s investment style. The loading coefficients on the value and quality factors vary between positive and negative across the sample and are almost always statistically insignificant (also true for the momentum and low-risk factors). In contrast, and like the univariate regressions, the multivariate regressions offer strong evidence to support the market and size factors’ association with Graham’s investment style. Ultimately, it appears that we may know less than previously thought as this sample does not support value and quality as being synonymous with Benjamin Graham and his approach to investing (at least as measured by his students/followers).
For a more complete performance analysis of this group of investors, to include out-of-sample data for Schloss and Ruane as well as results for monthly data for Ruane, please see “A Return to Graham-and-Doddsville: The Application of Performance Measurement to Buffett’s Superinvestors.”
Appendix


References[+]
| ↑1 | The value factor measures relative cheapness, while Graham-style investing is primarily concerned with absolute cheapness (i.e., discount from intrinsic value). A value stock or a growth stock can be discounted in the market when compared to intrinsic value. A stock’s classification as value or growth describes its relative position in the cross-section but provides no guidance as to its under/overvaluation when compared to intrinsic value. Therefore, it is actually quite logical that the value factor would not be synonymous with Graham-style investing since each is designed to capture a different concept of value. |
|---|---|
| ↑2 | Quality in the context of Graham-style investing is used to ascertain the appropriate capitalization rate for normalized earnings in order to calculate intrinsic value. |
| ↑3 | AA even did a little preview here |
| ↑4 | Rates of return as presented by Buffett (1984) and the data libraries are transformed into continuously compounded rates of return to account for Jensen’s (1969) horizon problem. It is also important to address the use of annual return data. With the exception of Ruane, higher frequency data for this group has been impossible to obtain. Letters were sent directly to the surviving super investors requesting assistance but without success. Mr. Buffett’s assistant was kind enough to provide a reply as well as Mr. Guerin’s widow but neither were able to provide any assistance. Multiple requests for assistance were also sent to the Heilbrunn Center at Columbia University as well as a request to Tweedy Browne but both of these avenues were also unsuccessful. Nevertheless, while annual data are not ideal, Austin and Steyerberg (2015) demonstrate that the number of observations per variable required in linear regression analyses may be much lower than previously thought. |
About the Author: Lloyd Everhart
—
Important Disclosures
For informational and educational purposes only and should not be construed as specific investment, accounting, legal, or tax advice. Certain information is deemed to be reliable, but its accuracy and completeness cannot be guaranteed. Third party information may become outdated or otherwise superseded without notice. Neither the Securities and Exchange Commission (SEC) nor any other federal or state agency has approved, determined the accuracy, or confirmed the adequacy of this article.
The views and opinions expressed herein are those of the author and do not necessarily reflect the views of Alpha Architect, its affiliates or its employees. Our full disclosures are available here. Definitions of common statistics used in our analysis are available here (towards the bottom).
Join thousands of other readers and subscribe to our blog.
