In our 2016 book “Your Complete Guide to Factor-Based Investor” Andrew Berkin and I recommended that due to the risks of data mining (or p-hacking)—researchers torture the data until it confesses—for you to consider investing in a factor it should have demonstrated a premium that was: persistent across long periods of time and economic regimes; pervasive across asset classes and around the globe; robust to various definitions; able to survive implementation costs; and that it had risk-based or behavioral explanations for why you should have confidence that the premium was likely to persist. While we preferred risk-based explanations (because risk cannot be arbitraged away), we recognized that there are limits to arbitrage that exist which prevent sophisticated investors from fully correcting mispricings and that human behavior tends not to change. By establishing this set of criteria, investors could have greater confidence that the premiums would likely persist. Having confidence in a strategy is a necessary ingredient for success because all risk assets/strategies go through long periods of underperformance.
While factor-based investing has been widely adopted in the equity markets, this has not been the case in bond markets. This is so despite the fact that in their 1993 paper “Common Risk Factors in the Returns on Stocks and Bonds,” Eugene Fama and Ken French proposed a two-factor (term and default) model to explain bond returns, in addition to the three equity factors of beta, size and value. Since then, other factors, ones that have provided premiums in equity markets, have been proposed as adding explanatory power to bond returns. For example, in their 2018 study “Style Investing in Fixed Income,” Jordan Brooks, Diogo Palhares, and Scott Richardson of AQR Capital Management identified four fixed-income style premiums:
- Value: the tendency for relatively cheap assets to outperform relatively expensive assets.
- Momentum: the tendency for an asset’s recent performance to continue in the near future.
- Carry: the tendency for higher-yielding assets to outperform lower-yielding assets.
- Defensive (or quality): the tendency of safer, lower-risk assets to deliver higher risk-adjusted returns than their low-quality, higher-risk counterparts.
They found that applying the four style premiums identified in other asset classes would have enhanced returns in various fixed-income markets over the past two decades. They concluded:
“Our empirical analysis suggests a powerful role for style-based investing in fixed income.”
Factors in Sovereign Government Bond Markets
Guido Baltussen, Martin Martensty, and Olaf Penninga contribute to the factor investing literature with their June 2021 study “Factor Investing in Sovereign Bond Markets: Deep Sample Evidence” in which they examined government bond factor premiums in a global sample over the period 1800-2020 and across 16 countries: Australia [beginning 1857], Belgium [1831], Canada [1953], Denmark Germany, France, the Netherlands, Spain, U.K., and the U.S. [1800], Italy [1807], Japan [1870], New Zealand [1861], Norway [1822], Sweden [1853], and Switzerland [1900]. (See here for another take on this paper).
They began by noting that prior research on government bond factors has typically covered a limited sample, roughly the period beginning in 1980. However, this recent period was unique as since 1980 yield levels have displayed a secular decline in most markets. “As a result, a key question is how bond factor premiums are influenced by falling or rising yield levels, and other episodes that are typically a concern for investors.” In other words, it would be helpful to know how the factors performed out-of-sample. Does the factor meet the persistence criteria? They answer that question with their global sample covering the 180 years prior to 1980 as well as updating the data through 2020.
Their focus was on three key bond factors: value, momentum, and low risk. Based on prior research findings they applied value and momentum across bond markets and low risk was applied on the bond curve. For momentum, their definition was the past 12-month returns minus the last month. For value, they focused on real yield defined as the 10-year bond yield minus the past year’s inflation (Value 1) and the term spread (Value 2). For low risk, they estimated the betas over a 36-month period for the different maturities and then went long the low beta maturities and short the high beta maturities. The position sizes of each short and long leg were chosen such that the ex-ante betas of both legs were equal, such that the factor has as little overall market effect as possible. Their data set for momentum and the term spread starts in 1800. For the real yield, making use of inflation data, the data starts in 1872. For the low-risk strategy on the U.S. curve the data on the shortest three maturities start in 1941, and the longer maturities start in 1919, allowing them to start the low-risk factor returns from 1922 onwards. Following is a summary of their findings:
- The bond factors of value, momentum and low-risk provided attractive premiums that did not decay across samples, were persistent over time, and consistent across various market and macroeconomic scenarios.
- Value, momentum, and low risk offered attractive factor premiums. Over the full sample the Sharpe ratios were 0.2 (t-stat=2.44) for Value 1, 0.54 (t-stat=8.0) for Value 2, 0.24 for momentum (t-stat=3.5) and 0.40 (t-stat=3.9) for low risk.
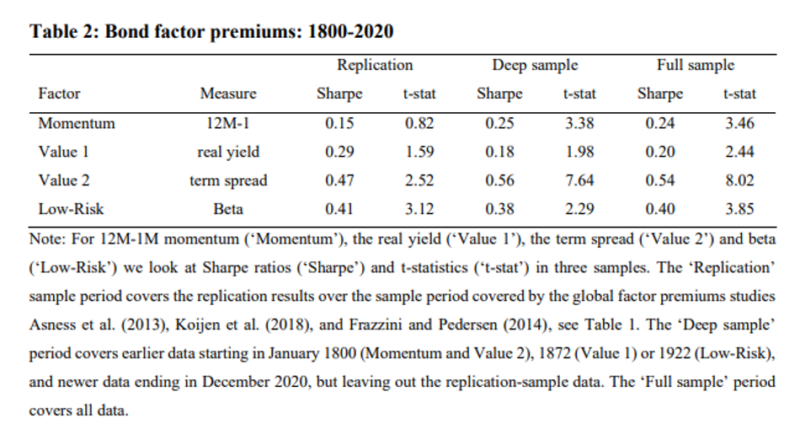
- The factor premiums were consistent over time, being positive in 72 percent (Momentum) to 92 percent (Value) of 10-year rolling periods.
- The factor premiums were effective diversifiers relative to each other, as well as to bond and equity market risks. The highest correlation among the four factors was just 0.34, the two value factors were negatively correlated (-0.18), and the correlation of the low risk factor to the other three was about 0.
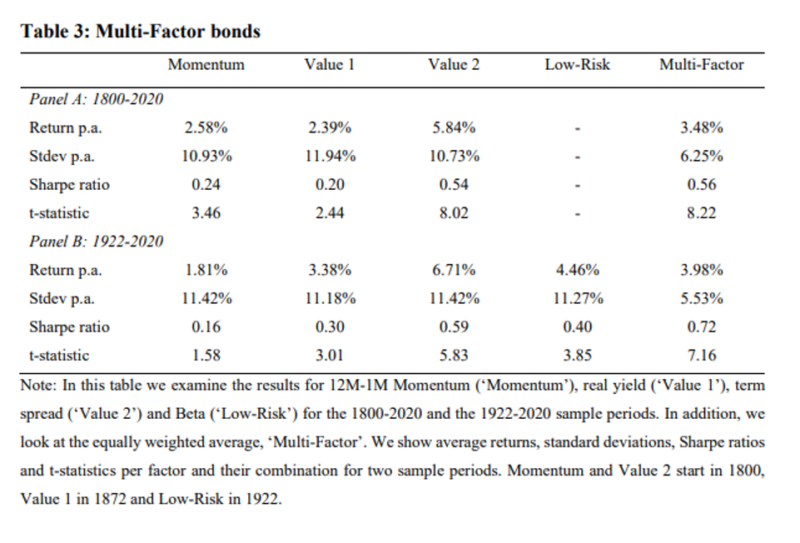
- A combined multi-factor (equal weighting the two value factors, momentum and low risk) bond strategy provided the strongest risk-adjusted returns.
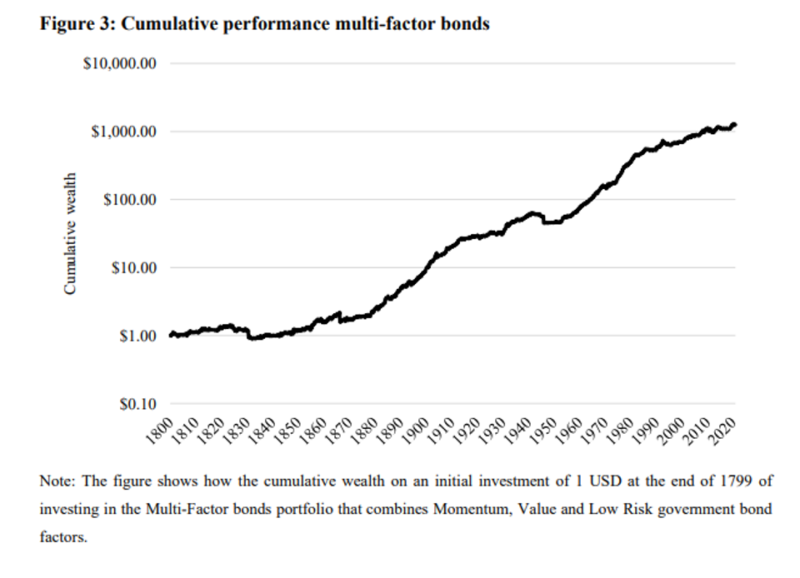
- Combining the factors into a simple multi-factor portfolio provided a highly significant Sharpe ratio of 0.56 (t-statistic of 8.22) from 1800 to 2020 and was positive in 89 percent of the 10-year rolling periods. In addition, multi-factor had a substantially lower annualized standard deviation of 6.3 percent, compared to the average of 11.2 percent for the individual factors. Results were robust to various weighting schemes.
- Multi-factor bond portfolios provided robust performance over various macroeconomic states that are typically a concern for investors, including recessions and expansions, crisis and non-crisis periods, years with either rising or declining yields, years with above or below median inflation, and years with positive or negative equity returns.
- Combining a multi-factor long-short strategy with a long-only passive strategy that invested equal-weighted in all global bond markets improved the Sharpe ratio from 0.52 to 0.69 (adding 50 percent multi-factor bonds) or 0.77 (adding 100 percent multi-factor bonds).
- When combined with time-series momentum, multi-factor strategies improved performance.
Their findings led Baltussen, Martensty, and Penninga to conclude that:
“results strongly show a consistent added value of government bond factor premiums over a passive bond portfolio.”
What are the implications of the identification of factors explaining bond returns? As Andrew Berkin and I explain in our book “Your Complete Guide to Factor-Based Investing,” the identification of explanatory factors converts what was once alpha (which investors are willing to pay a premium for) into beta (a commodity, with commodity-like pricing).
Implications for Active Managers
Stephen Laipply, Ananth Madhavan, Aleksander Sobczyk, and Matthew Tucker, authors of the 2020 study “Sources of Excess Return and Implications for Active Fixed-Income Portfolio Construction,” demonstrated that almost all returns to active funds were explained by static exposure to common factors—manager skill made virtually no contribution, and there was no evidence of a consistent level of skill across alpha sources. In other words, investors could basically replicate the performance of active managers through simple combinations of low-cost government, investment-grade credit and high-yield credit exchange-traded funds, or ETFs (bond ETFs can cost less to trade than individual securities), which can provide a continuum of exposure to credit risk and a range of duration exposures.
Their findings were consistent with prior literature, including the 2019 study “Give Credit Where Credit Is Due: What Explains Corporate Bond Returns?” by Roni Israelov. Israelov found that systematic exposures compensate bond investors via the bond, equity, equity volatility, and bond volatility risk premia. However, idiosyncratic exposures (obtained via individual security selection) provide risk without reward, on average.
These findings are also consistent with those of Peter Mladina and Steven Germani, authors of the study “Bond-Market Risk Factors and Manager Performance.” For example, they found that the U.S. investment-grade bond market is almost perfectly explained by the three common risk factors of term, default, and prepayment (many corporate bonds and municipal bonds have call provisions, as do mortgage-backed securities). Interestingly, they also found that “the default factor is redundant with the market factor of equities—it is merely a linear combination of the Fama-French market factor.” This finding led them to conclude that because the default factor is well explained by the exposure to market beta, along with the very small default premium, it calls into question the prudence of investing in publicly traded high-yield bonds—especially after considering the higher costs of actively managed high-yield bond funds.
Their findings are also consistent with those of Harald Henke, Hendrik Kaufmann, Philip Messow, and Jieyan Fang-Klingler who investigated the application of factor investing in corporate bonds in their study “Factor Investing in Credit,” published in the Summer 2020 issue of The Journal of Index Investing. They analyzed five different long-only (investing in quintile 5) factor investment strategies (value, equity momentum, carry, quality, size) within the U.S. investment-grade (IG) and high-yield (HY) markets. Their data sample covered the period 2000-2018. They found that the five factors explained a significant part of the cross-sectional variation in corporate bond excess returns and that combinations of the single factors have provided superior risk-adjusted returns (after trading costs) since 2000.
Summary
The reported results we covered have important implications for investors in terms of portfolio construction, risk monitoring, and manager selection. Because these common factors explain almost all the returns of bond portfolios, investors should construct their bond portfolios using low-cost, passively (systematically) managed funds with these factors in mind and then carefully monitor their exposure to these systematic risks.
Important Disclosures
The information presented herein is for educational purposes only and should not be construed as specific investment, accounting, legal or tax advice. Certain information may be based on third party data which may become outdated or otherwise superseded without notice. Third party information is deemed to be reliable, but its accuracy and completeness cannot be guaranteed. Indices are not available for direct investment. Their performance does not reflect the expenses associated with the management of an actual portfolio nor do indices represent results of actual trading. Performance is historical and does not guarantee future results. By clicking on any of the links above, you acknowledge that they are solely for your convenience, and do not necessarily imply any affiliations, sponsorships, endorsements or representations whatsoever by us regarding third-party Web sites. We are not responsible for the content, availability or privacy policies of these sites, and shall not be responsible or liable for any information, opinions, advice, products or services available on or through them. The opinions expressed by featured authors are their own and may not accurately reflect those of the Buckingham Strategic Wealth® or Buckingham Strategic Partners® (collectively Buckingham Wealth Partners). LSR-21-119
About the Author: Larry Swedroe
—
Important Disclosures
For informational and educational purposes only and should not be construed as specific investment, accounting, legal, or tax advice. Certain information is deemed to be reliable, but its accuracy and completeness cannot be guaranteed. Third party information may become outdated or otherwise superseded without notice. Neither the Securities and Exchange Commission (SEC) nor any other federal or state agency has approved, determined the accuracy, or confirmed the adequacy of this article.
The views and opinions expressed herein are those of the author and do not necessarily reflect the views of Alpha Architect, its affiliates or its employees. Our full disclosures are available here. Definitions of common statistics used in our analysis are available here (towards the bottom).
Join thousands of other readers and subscribe to our blog.