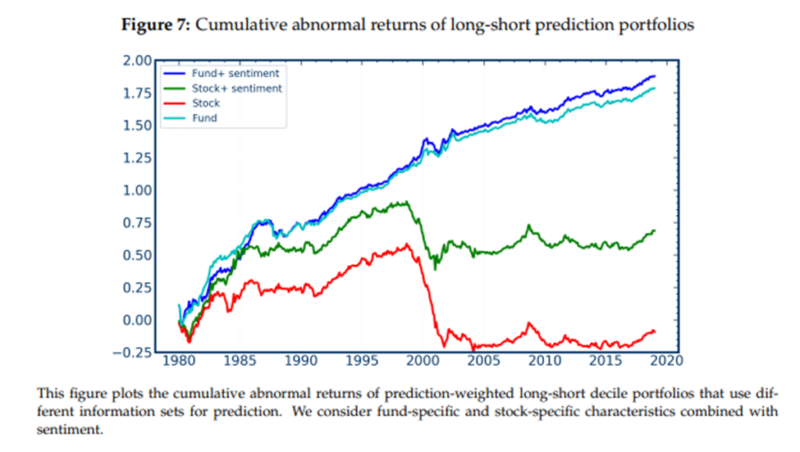
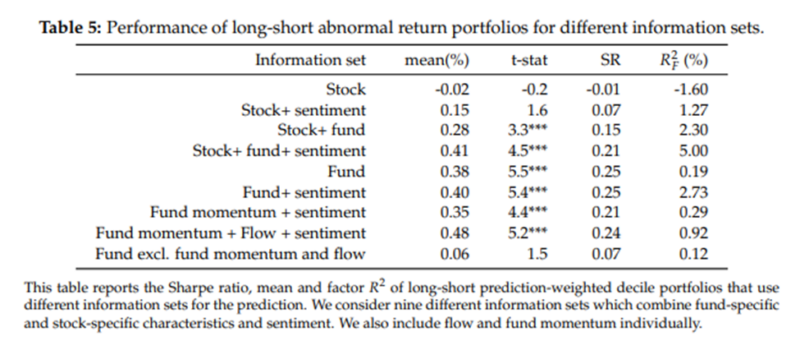
Ron Kaniel, Zihan Lin, Markus Pelger, and Stijn Van Nieuwerburgh contribute to the asset pricing literature with their January 2022 study “Machine-Learning the Skill of Mutual Fund Managers” in which they used machine learning in the form of an artificial neural network to examine the universe of actively traded U.S. equity mutual funds between 1980 and 2019 and the stocks they hold in order to determine which, if any, characteristics can help identify future outperformers. They benchmarked performance against the Carhart four-factor model (beta, size, value, and momentum) as well as an eight-factor model that added investment, profitability, short-term reversal, and long-term reversal. They also examined 46 stock characteristics weighted by the funds’ holdings and 13 fund and fund family characteristics. The fund characteristics included fund return momentum and fund flow. In addition, they included a variable that summarized the overall state of the market proxied either by investor sentiment or by a comprehensive measure of macroeconomic activity (Chicago Fed National Activity Index). Following is a summary of their findings:
- Machine learning was able to identify fund characteristics that differentiated relatively high-performing from relatively low-performing mutual funds.
- The model predictions generated a large difference in performance out of sample, with most of the benefit coming from avoiding the underperformers. Buying the 10% of mutual funds with the best predicted performance each month and using the model not only to select but also to weight the funds within the top decile generated a cumulative abnormal return of 72% over the sample period. Buying the 10% of mutual funds with the worst predicted performance each month produced a cumulative abnormal return of ‑119%. The 191% difference in out-of-sample performance based on the model’s predictions was economically large and statistically significant.
- The results were robust to alternative holding period assumptions—the predictability of economically significant relative performance lasted for three years.
- About 10 to 20% of funds generated positive abnormal returns even after fees.
- Most of the benefits accrued from avoiding the worst-performing funds—the effect came mostly from the short leg.
- The best and the worst funds had similar fees.
- Fund momentum and fund flow are the most important predictors of future risk-adjusted fund performance. In addition, these two fund characteristics matter much more when investor sentiment is high—high sentiment periods coincided with more fund return predictability.
- Characteristics of the stocks that funds hold are not predictive—little can be learned about fund abnormal returns from the factor exposure of the stocks they hold.
- The level of fund (and stock) returns is extremely hard to predict.


Their findings led the authors to conclude:
“The salience of flow and fund return momentum as the key predictors suggests that some investors can detect skill and (re)allocate their investment towards such skilled managers. This reallocation of investment flows is not as strong as the frictionless model Berk and Green (2004) predicts. Skill leaves a trail in the form of fund return momentum for investors to exploit in the next period. Put differently, the flows are gradual and small enough that it takes several periods until the fund runs into zero marginal abnormal returns.”
However, they added:
“The results are potentially also consistent with funds and fund families attracting flows through marketing rather than—or in addition to—through investment skill. … Marketing-induced inflows create buying pressure for stocks that the fund typically invests in. In a world with downward-sloping demand curves, this raises prices and lifts fund returns. Through the flow-performance relationship, as well as through persistence in marketing-driven flows, the out-performance creates more inflows in the next period. The demand pressure increases prices further, generating momentum in fund returns. The fact that flows and fund momentum have a much stronger association with fund performance in high-sentiment periods lends further credence to this marketing-driven channel.”
Investor Takeaways
The finding that momentum in fund returns can help investors in actively managed funds identify relative winners and losers among fund managers should not be a total surprise, as momentum has been found to exist in virtually all markets (stock, bonds, commodities, and currencies) and even in factors (more here). Even investors using passive/systematic strategies (such as index funds) can utilize this information in how and when they trade. For example, they could consider delaying trading (such as rebalancing or adding new cash flows) to take advantage of the information from fund momentum and fund flows.
Finally, a word of caution on applying the findings of machine learning (see an application to factor investing here). A major benefit of artificial intelligence tools (such as machine learning) is that they have a great capacity to deal with massive amounts of data. But that also creates the risk that findings can be the result of “torturing the data until it confesses”—correlation doesn’t necessarily mean causation. Thus, it is critical that any findings should be supported by either risk- or behavioral-based explanations, and those findings should be persistent across economic regimes, pervasive across asset classes and regions, and survive transaction costs. In this case, the finding regarding momentum’s explanatory power is consistent with the literature (as demonstrated in Your Complete Guide to Factor-Based Investing), and the finding on cash flow’s predictive power is also consistent with the finding on momentum. That consistency provides more confidence that the findings are not the result of data mining.
Important Disclosures:
For informational and educational purposes only and should not be construed as specific investment, accounting, legal, or tax advice. Certain information is based upon third party data which may become outdated or otherwise superseded without notice. Third party information is deemed to be reliable, however its accuracy and completeness cannot be guaranteed. By clicking on any of the links above, you acknowledge that they are solely for your convenience, and do not necessarily imply any affiliations, sponsorships, endorsements or representations whatsoever by us regarding third-party websites. We are not responsible for the content, availability or privacy policies of these sites, and shall not be responsible or liable for any information, opinions, advice, products or services available on or through them. The opinions expressed by featured authors are their own and may not accurately reflect those of the Buckingham Strategic Wealth® or Buckingham Strategic Partners®, collectively Buckingham Wealth Partners. Neither the Securities and Exchange Commission (SEC) nor any other federal or state agency have approved, determined the accuracy, or confirmed the accuracy of this article. LSR-21-239
About the Author: Larry Swedroe
—
Important Disclosures
For informational and educational purposes only and should not be construed as specific investment, accounting, legal, or tax advice. Certain information is deemed to be reliable, but its accuracy and completeness cannot be guaranteed. Third party information may become outdated or otherwise superseded without notice. Neither the Securities and Exchange Commission (SEC) nor any other federal or state agency has approved, determined the accuracy, or confirmed the adequacy of this article.
The views and opinions expressed herein are those of the author and do not necessarily reflect the views of Alpha Architect, its affiliates or its employees. Our full disclosures are available here. Definitions of common statistics used in our analysis are available here (towards the bottom).
Join thousands of other readers and subscribe to our blog.
