At its most basic level, factor-based investing is simply about defining, and then systematically following, a set of rules that produce diversified portfolios. An example of factor-based investing is a value strategy, buying cheap (low valuation) assets and selling expensive (high valuation) assets.
A problem with factor-based investing is that smart people with powerful computers can find factors that have worked in the past but are not real—they are the product of randomness and selection bias (referred to as data snooping, or data mining). The problem of data mining is compounded when researchers snoop without first having a theory to explain the finding they expect, or hope, to find. Without a logical explanation for an outcome, one should not have confidence in its predictive ability.
“P-hacking” refers to the practice of reanalyzing data in many different ways until you get a desired result. For most studies, statistical significance is defined as a “p-value” less than 0.05—the difference observed between two groups would not be seen even 1 in 20 times by chance. That may seem like a high hurdle to clear in order to prove that a difference is real. However, what if 20 comparisons are done, and only the one that “looks” significant is presented?
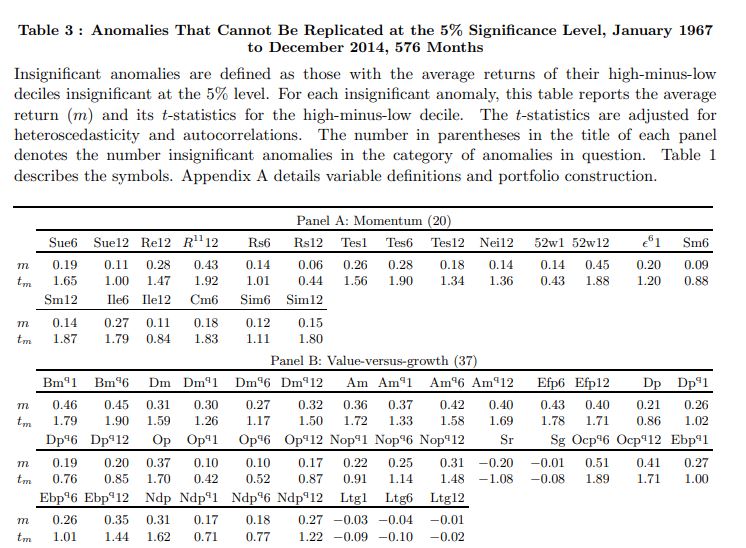
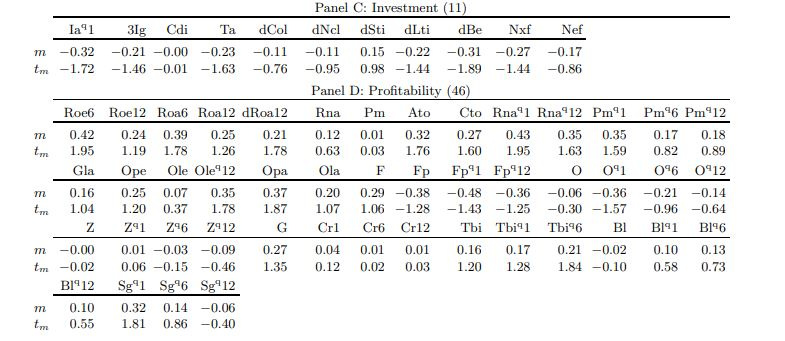
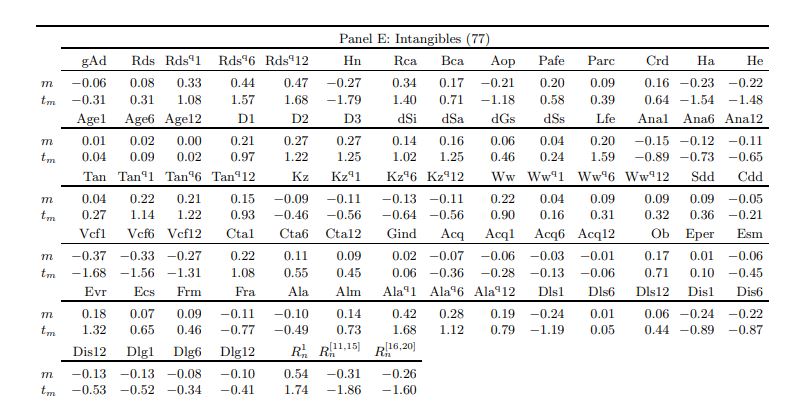
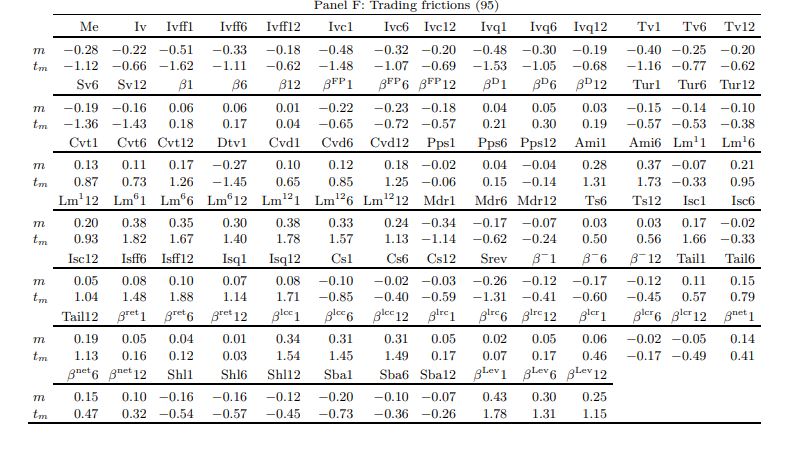
The problem of data mining or p-hacking is so acute that Professor John Cochrane famously said that financial academics and practitioners have created a “zoo of factors.” For example, a May 11, 2017, article in The Wall Street Journal stated: “Most of the supposed market anomalies academics have identified don’t exist, or are too small to matter.” In their May 2017 study “Replicating Anomalies,” Kewei Hou, Chen Xue and Lu Zhang conducted the largest replication of the entire anomaly literature, compiling a data library with 447 anomaly variables. Having found that almost two-thirds of the anomalies were insignificant at the 5 percent confidence level and that even anomalies that showed statistical significance had magnitudes much lower than reported in the original articles, they concluded that p-hacking is widespread in the literature. Among the biggest casualties were the illiquidity and distress factors, which were found to be insignificant.


Jules van Binsbergen, Liang Ma and Michael Schwert, authors of the September 2022 study “The Factor Multiverse: The Role of Interest Rates in Factor Discovery,” posed an interesting question: Are the findings of at least some of the reported anomalies the direct result of the 40-year secular decline in global interest rates and thus not really anomalies? To examine the importance of the decline in interest rates in the discovery of asset pricing anomalies, they investigated 153 discovered anomalies as well as 1,395 potential undiscovered anomalies by constructing a set of hypothetical portfolio sorts based on 233 accounting variables available in Compustat with sufficient data coverage, each scaled by one of the following six variables: the market value of the firm’s assets and equity; the book value of the firm’s assets, equity and debt; and firm sales, where appropriate. They began by noting that now that the secular decline in interest rates has ended, a reevaluation of relevant anomalies going forward was warranted. To this end, they used a duration-based interest rate adjustment procedure to classify anomalies into false positives, false negatives and those robust to the effect of interest rates.
They corrected for the effect of the decline in interest rates by constructing a duration-matched fixed income portfolio for each long or short portfolio (as they could have very different duration of cash flows) in each portfolio sort. The duration matching was performed on a dividend-strip-by-dividend-strip basis—they used the current dividend yield for each long or short portfolio in each month to fit a Gordon Growth Model, and used the implied difference between the expected return and the growth rate to construct a weighting scheme that was then utilized to build a duration-matched fixed income portfolio. They then calculated the return spread between the fixed income portfolio for the long portfolio and that for the short portfolio, and referred to it as the fixed income return spread. They then obtained the counterfactual anomaly return, which represents the anomaly return that would have been observed if there were no interest rate decline, as the difference between the raw anomaly return and the fixed income return spread. Their data sample covered the period July 1963-December 2020. Following is a summary of their findings:
- Adjusting for interest rate changes had an important effect on a substantial fraction of both discovered and undiscovered anomalies.
- The average dividend yield spread showed wide variations across anomalies, ranging from -4.06 percent to 6.60 percent, suggesting that the interest rate decline would affect the return spread for a large number of anomalies and that the effect would be positive for some anomalies and negative for others. The implication is that after duration-matched adjustment for interest rate changes, some anomalies become stronger while others become weaker.
- Of the 153 original anomalies, just 63 of them were robust with t-statistics higher than 1.96 in absolute value with or without the adjustment for interest rate changes. In contrast, 21 of them could be classified as false positives (raw original t-statistic higher than 1.96 and adjusted t-statistic lower than 1.96).
- Among the most prominent anomalies that belonged to the group of false positives and negatives were gross profitability, return on assets, quality-minus junk and maximum daily return.
- Out of the 1,395 potential anomalies, they found 108 robust anomalies, 100 false positives and 46 false negatives.
Their findings led van Binsbergen, Ma and Schwert to conclude: “Simply by changing the excess return definition to account for the role of duration-matched (long-term) fixed income returns, a different set of anomalies emerges.” They added: “As the downward trend in interest rates has reversed, the valuation windfalls that have resulted from the secular declining rate environment are unlikely to happen again, suggesting that those anomalies that are robustly present regardless of the excess return definition are arguably more likely to persist in the future.”
Investor Takeaways
In our book “Your Complete Guide to Factor-Based Investing: The Way Smart Money Invests Today,” Andrew Berkin and I provided investors with a list of criteria that had to be met in order to minimize the risk of p-hacking. For a factor to be considered, it must provide explanatory power to portfolio returns, have delivered a premium (higher returns), and it must be:
- Persistent—It holds across long periods of time and different economic regimes, minimizing the risk that the finding isn’t just a lucky outcome specific to one short period of time.
- Pervasive—It holds across countries, regions, sectors and even asset classes, minimizing the risks of p-hacking.
- Robust—It holds for various definitions (for example, there is a value premium whether it is measured by price-to-book, earnings, cash flow or sales); it is not dependent on one formation that might have been a result of data snooping.
- Investable—It holds up not just on paper but also after considering actual implementation issues, such as trading costs. In other words, we answer the question: Even if we believe the factor is real, can a practical investor really make money from it after costs?
- Intuitive—There are logical risk-based or behavioral-based explanations for its premium and why it should continue to exist.
The evidence presented by van Binsbergen, Ma and Schwert suggests another criteria should be considered given that absent the interest-rate decline, the asset pricing literature would likely entertain a different set of anomalies today. With that said, the good news is that among all the factors in the zoo, Berkin and I showed that you need to focus only on the eight that meet all of our criteria: beta, size, value, momentum, profitability, quality, term and carry. Of these, Van Binsbergen, Ma and Schwert’s findings raise questions only about the profitability and quality factors and their persistence.
What about all those other factors in the zoo? Some have not passed the test of time, fading away after their discovery, perhaps because of data mining or random outcomes. Or perhaps the factors worked only for a special period, regime or narrow band of securities. And many factors have explanatory power that is already well captured by the factors we recommend. In other words, they are variations on a common theme (e.g., the many definitions of value).
If you are considering or already engaged in factor-based investing, I offer these words of caution from the conclusion of our book: “First, as we have discussed, all factors—including the ones we have recommended—have experienced long periods of underperformance. So, before investing, be sure that you believe strongly in the rationale behind the factor and the reasons why you trust it will persist in the long run. Without this strong belief, it is unlikely that you will be able to maintain discipline during the inevitable long periods of underperformance. And discipline is one of the keys to being a successful investor. Finally, because there is no way to know which factors will deliver premiums in the future, we recommend that you build a portfolio broadly diversified across them. Remember, it has been said that diversification is the only free lunch in investing. Thus, we suggest you eat as much of it as you can!”
Larry Swedroe is chief research officer for Buckingham Wealth Partners and Buckingham Strategic Wealth.
For informational and educational purposes only and should not be construed as specific investment, accounting, legal, or tax advice. Certain information is based upon third party data which may become outdated or otherwise superseded at any time without notice. Third party information is deemed to be reliable, but its accuracy and completeness cannot be guaranteed. By clicking on any of the links above, you acknowledge that they are solely for your convenience, and do not necessarily imply any affiliations, sponsorships, endorsements or representations whatsoever by us regarding third-party websites. We are not responsible for the content, availability or privacy policies of these sites, and shall not be responsible or liable for any information, opinions, advice, products or services available on or through them. The opinions expressed by featured authors are their own and may not accurately reflect those of Buckingham Strategic Wealth® or Buckingham Strategic Partners ®, collectively Buckingham Wealth Partners. Neither the Securities and Exchange Commission (SEC) nor any other federal or state agency have approved, determined the accuracy, confirmed the adequacy of this article. LSR-22-392
About the Author: Larry Swedroe
—
Important Disclosures
For informational and educational purposes only and should not be construed as specific investment, accounting, legal, or tax advice. Certain information is deemed to be reliable, but its accuracy and completeness cannot be guaranteed. Third party information may become outdated or otherwise superseded without notice. Neither the Securities and Exchange Commission (SEC) nor any other federal or state agency has approved, determined the accuracy, or confirmed the adequacy of this article.
The views and opinions expressed herein are those of the author and do not necessarily reflect the views of Alpha Architect, its affiliates or its employees. Our full disclosures are available here. Definitions of common statistics used in our analysis are available here (towards the bottom).
Join thousands of other readers and subscribe to our blog.

