Over the very long term, while value stocks have been less profitable and have had slower growth in earnings than growth stocks, they have provided higher returns. Among the reasons are that value stocks have traded at substantial valuation discounts compared to growth stocks, and reversion to the mean of abnormal (both abnormally high and abnormally low) growth in earnings has been greater than the market anticipated. The challenge for value investors is that, as with all risk assets, value stocks can suffer through long periods of underperformance (such as in the late 1990s and over the period 2017 through 2020, when the value premium suffered its worst drawdown ever).
The academic research has found a way to improve on systematic value investing. In his 2010 study “The Other Side of Value: Good Growth and the Gross Profitability Premium,” Robert Novy-Marx demonstrated:
- Profitability, as measured by gross profits-to-assets, has roughly the same power as book-to-market in predicting the cross-section of average returns.
- Profitable firms generate significantly higher average returns than unprofitable firms, despite having, on average, lower book-to-markets and higher market capitalizations.
- Controlling for profitability also dramatically increases the performance of value strategies, especially among the largest, most liquid stocks.
- Controlling for gross profitability explains most earnings-related anomalies and a wide range of seemingly unrelated profitable trading strategies.
With the publication of Novy-Marx’s work, leading research-oriented funds, such as those of AQR and Dimensional, began to incorporate profitability screens into the systematic construction rules of their value funds. While value stocks have underperformed since the Great Recession, the following chart from Vanguard shows that the underperformance is explained by the long-running decline in their relative value, a level only exceeded at the end of 2020. Note that over the period November 2020 through July 2023, the Fama-French U.S. Value Research Index returned 25.6%, outperforming the S&P 500, which returned 14.9%, and the Fama-French U.S. Growth Research Index, which returned 13.1%.
Value Stocks’ Aggregate Price/Book Ratio Divided by Growth Stocks’ Aggregate Price/Book Ratio
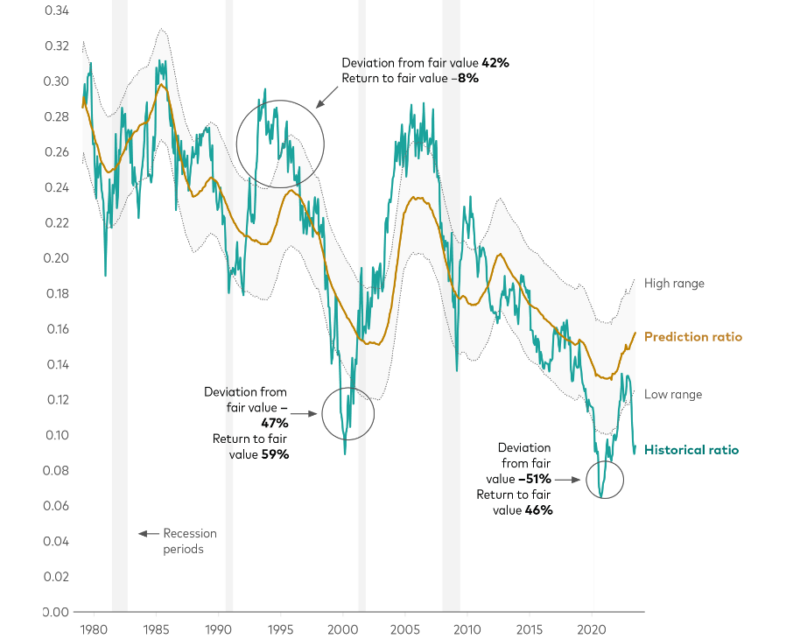
The results are hypothetical results and are NOT an indicator of future results and do NOT represent returns that any investor actually attained. Indexes are unmanaged and do not reflect management or trading fees, and one cannot invest directly in an index.
While U.S. value stocks have underperformed since the Great Recession, international value stocks have performed even worse. Over the period January 2008 through August 2023, while the MSCI USA Value Index returned 7.0%, the MSCI All Country World ex USA IMI Value Index returned just 2.3%. What’s particularly interesting about the relative performance is that European value companies, at least those trading below their book value, have been more profitable than their U.S. counterparts.
In his September 2023 research paper “More Bang for Your Buck,” Verdad’s Brian Chingono noted: “Among firms that trade at a discount to book value, Europe has a Gross Profit/Assets ratio of 18.5%, which is 1.5x the profitability of North American value firms. The differences are even more stark in terms of EBITDA/Assets, with Europe’s value firms delivering a 6.4% return on assets, almost 3x higher than North America’s profitability among value firms.” The chart below shows profitability measured in two ways: gross profit per dollar of assets and EBITDA per dollar of assets. As you can see, European and Japanese value stocks have been significantly more profitable than their North American counterparts. Despite the superior profitability, they have underperformed, with the result being that they are trading at historically cheap levels.
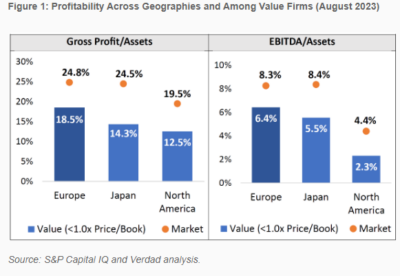
The results are hypothetical results and are NOT an indicator of future results and do NOT represent returns that any investor actually attained. Indexes are unmanaged and do not reflect management or trading fees, and one cannot invest directly in an index.
Chingono found: “Measured as the spread between the cheapest 30% of stocks and the most expensive 30% by Price/Book, the valuation spread in Europe reached its most extreme level in 2021 when value stocks traded at 0.8x Price/Book. Today, Europe’s value segment still trades at 0.8x Price/Book, according to data from S&P Capital IQ. So even as fundamentals for Europe’s value stocks have improved over the past three years, they remain extremely cheap relative to growth stocks, with spreads more than two standard deviations away from their 48-year historical average.”
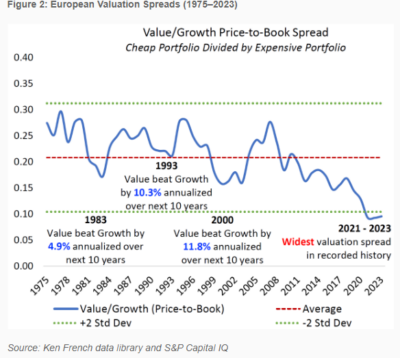
The results are hypothetical results and are NOT an indicator of future results and do NOT represent returns that any investor actually attained. Indexes are unmanaged and do not reflect management or trading fees, and one cannot invest directly in an index.
His findings led Chingono to conclude:
“We believe that the combination of historically wide valuation spreads in Europe and higher levels of profitability among Europe’s value stocks bolster the case for upward mean reversion going forward. Historically, mean reversion in multiples has supported significant outperformance of value relative to growth, as shown in the above chart. And even if the mean reversion process takes time to play out, investors in European value stocks can earn a higher return on assets while they wait for multiple expansion.”
I agree.
Investor Takeaways
While value stocks have provided higher returns than growth stocks, like all strategies that invest in risky assets, value investors experience long periods of underperformance. Such periods test investor discipline. Sadly, it is my experience that while economists know that when it comes to risk assets, returns over periods of 10 years or even longer are likely to be just “noise,” most investors think that three years is a long time to judge performance, five years a very long time, and ten years an eternity. That belief leads them to sell after periods of underperformance. This is even though such periods generally result in asset trading at historically cheap levels.
As Figure 2 above demonstrates, while cheap assets can sell at cheap prices for extended periods, such periods have typically resulted in a powerful reversion to means. The result is that yesterday’s losers tend to be tomorrow’s winners. The following table shows the results from Avantis’ research on the information contained in valuation spreads. Avantis examined the historical data from December 31, 1979 through December 31, 2019. The table below clarifies that the valuation spread contains information about future returns—the future value premium tends to be much higher following periods when the valuation spread is above the median spread, and it’s well above the median today.
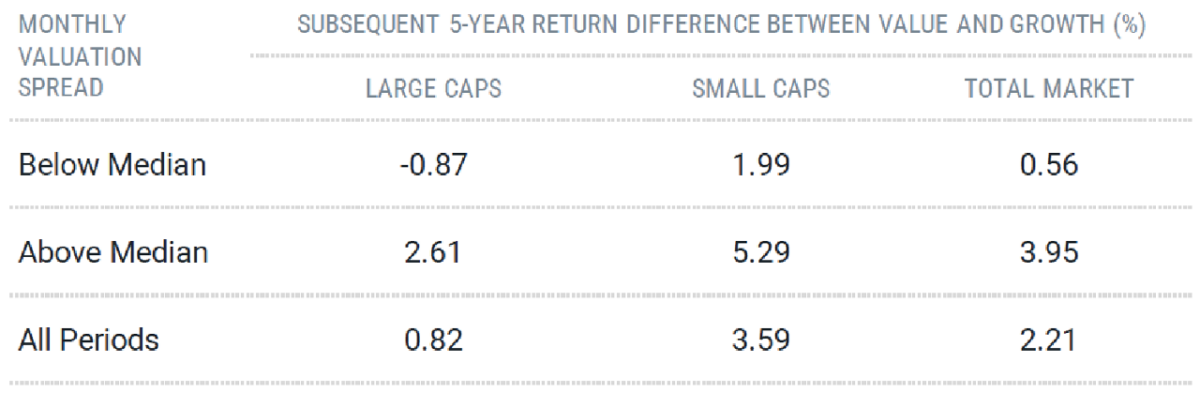
The results are hypothetical results and are NOT an indicator of future results and do NOT represent returns that any investor actually attained. Indexes are unmanaged and do not reflect management or trading fees, and one cannot invest directly in an index.
Investing is about uncertainty. The best we can do is to put the odds in our favor. The empirical evidence is why Chingono believes that the combination of historically wide valuation spreads in Europe and higher levels of profitability among Europe’s value stocks bolster the case for upward mean reversion going forward—he’s putting the odds in his favor. That’s the main takeaway for investors. The other is to remember that the key to successful investing is having the discipline to stay the course.
Larry Swedroe is the author or co-author of 18 books on investing, including his latest Enrich Your Future. For informational and educational purposes only and should not be construed as specific investment, accounting, legal, or tax advice. Neither the Securities and Exchange Commission (SEC) nor any other federal or state agency have approved, determined the accuracy, or confirmed adequacy of this article. Certain information may be based on third party data and may become outdated or otherwise superseded without notice. Third party information is deemed to be reliable, but its accuracy and completeness cannot be guaranteed. By clicking on any of the links above, you acknowledge that they are solely for your convenience, and do not necessarily imply any affiliations, sponsorships, endorsements or representations whatsoever by us regarding third-party websites. Buckingham is not responsible for the content, availability or privacy policies of these sites, and shall not be responsible or liable for any information, opinions, advice, products or services available on or through them. The opinions expressed here are their own and may not accurately reflect those of Buckingham Wealth Partners. LSR-23-556
About the Author: Larry Swedroe
—
Important Disclosures
For informational and educational purposes only and should not be construed as specific investment, accounting, legal, or tax advice. Certain information is deemed to be reliable, but its accuracy and completeness cannot be guaranteed. Third party information may become outdated or otherwise superseded without notice. Neither the Securities and Exchange Commission (SEC) nor any other federal or state agency has approved, determined the accuracy, or confirmed the adequacy of this article.
The views and opinions expressed herein are those of the author and do not necessarily reflect the views of Alpha Architect, its affiliates or its employees. Our full disclosures are available here. Definitions of common statistics used in our analysis are available here (towards the bottom).
Join thousands of other readers and subscribe to our blog.