Many retail investors focus on generating what they consider to be income, leading to the popularity of dividend-focused strategies. To take advantage of this demand, investment firms have marketed covered call strategies that are purported to not only generate income but also reduce volatility. Covered calls involve selling call options on a security owned by a fund in exchange for a premium. The premium is marketed as additional income for the investor. A good example is the recent U.S. News &World Report article “7 High-Yield Covered Call ETFs Income Investors Will Love,” the subhead of which is “Covered call strategies can help investors unlock higher-than-average income potential from their portfolio.” The author stated:
“Derivative strategies that employ a covered call overlay can transform a variety of mundane investment assets into income-generating machines.” The problem is that the premium is not income. Instead, it is a risk premium for shorting market volatility—an important distinction.
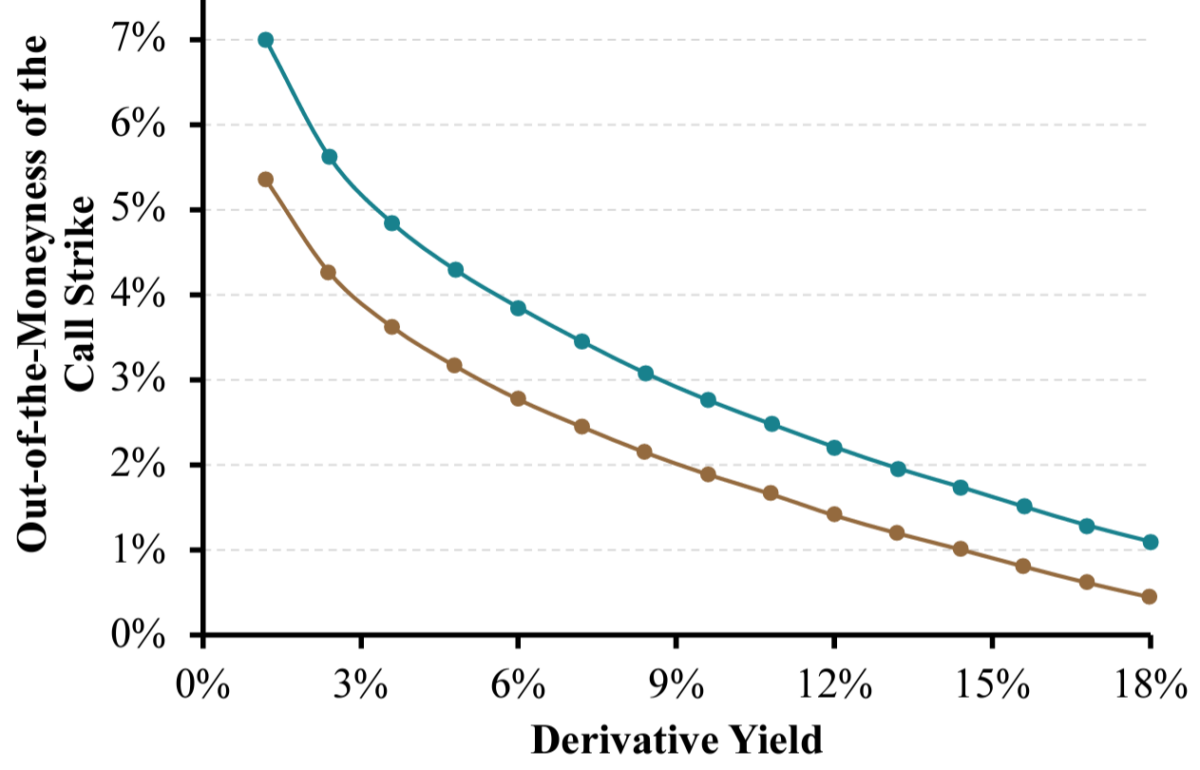
Derivative, income-seeking, covered call strategies have considerable control over the yield they seek to generate because, holding the maturity fixed, call option prices monotonically decrease along with the strike price (the lower the strike price, the greater the premium). If you want to generate more “income,” just choose a lower strike price that is closer to the money. However, by doing so you increase the exposure to market volatility, incurring greater risk. You also reduce your exposure to market beta and its risk premium.
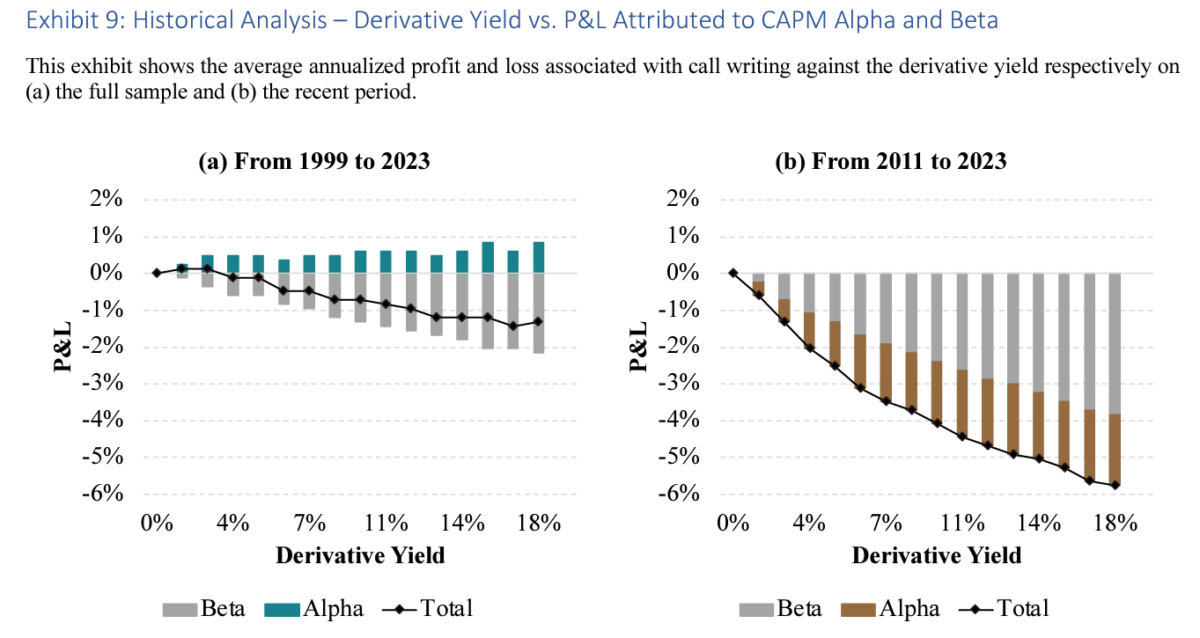
Roni Israelov and David Ndong, authors of the October 2023 study “A Devil’s Bargain: When Generating Income Undermines Investment Returns,” analyzed the performance of covered call strategies for the S&P 500 Index and the traditional S&P 500 index (SPX) options over two periods: January 1999-June 2023 and the subperiod January 2011-June 30, 2023. Their objective was to ascertain the relationship between different important call option characteristics and a target derivative yield. At each monthly rebalance, they sequentially selected a monthly yield target, 0.10% to 1.5% (i.e., from 1.2% to 18% annualized yield) with a 10 basis point increment in monthly target yield. At the roll date, the new call option contract to be sold was the one that expired on the third Friday of the following month and whose premium was the closest to the target premium. Each option contract was held until expiration on its settlement date, and a new contract was sold at the end of the same day. Surprisingly, they found that the round-trip transaction of selling an S&P 500 index call option over the full period, on average, had lost money. They also found that the more yield the strategy generated, the greater the losses – “high-yield covered call underperformed the low-yield covered call, and materially so.” In other words, selling calls generated yield (not income) but resulted in losses, and the greater the yield, the worse the losses!
Israelov and Ndong offered the following examples:
“Consider for example a goal of generating a 6% annualized derivative yield by selling index call options. Each month, a strike is selected to sell a call option with a targeted price that is 0.50% of the SPX index value. Over the period from 1999 to 2023, these options settled at maturity with a value of 0.54% of the SPX index value versus an average sale price of 0.49% of the SPX index value. The P&L from selling the call option was a loss of 0.05% per month or an annualized loss of 0.60%. What if we targeted a 12% annualized yield (1% monthly) instead? These options settled on average for 1.09%, leading to a 0.09% monthly loss, or a 1.08% annualized loss. Higher yield led to bigger losses. The recent period was even worse. Over the period 2011 to 2023, the 6% yield-targeting call-selling strategy had an annualized P&L of -3.1%, and selling calls to generate 12% annualized yield lost 4.7% per annum.”
In other words, being short equity and short equity volatility exposures detracted from performance.
The results are hypothetical results and are NOT an indicator of future results and do NOT represent returns that any investor actually attained. Indexes are unmanaged and do not reflect management or trading fees, and one cannot invest directly in an index.
Israelov and Ndong noted that higher-yielding options lowered the exposure to the market beta premium, reducing exposure to the equity risk premium—high-yield covered calls tended to have equity betas closer to 0.75 versus a nearly 1.0 equity beta for the low-yield covered calls. While the higher yielding options increased exposure to the volatility risk premium, it seemed that was not enough of an increase to offset the decrease in exposure to the equity risk premium.
One explanation for this result, with the worsening of performance in the more recent period, is that the popularity of the yield-enhancing strategies led to overcrowding, which resulted in shrinking premiums and thus undervaluation of call options—the curse of popularity (see chart below).

The results are hypothetical results and are NOT an indicator of future results and do NOT represent returns that any investor actually attained. Indexes are unmanaged and do not reflect management or trading fees, and one cannot invest directly in an index.
Israelov and Ndong also noted that call option selling introduces short convexity, which creates an undesirable asymmetric exposure: Upside equity exposure declines faster than downside equity exposure as derivative income increases, and the greater the derivative income, the less desirable the asymmetric exposure. In theory, investors should be compensated for that risk. However, some investors will find that to be a poor trade-off.
Their findings led Israelov and Ndong to conclude:
“We believe it is nearly irrefutable that higher derivative income covered call strategies should be expected to deliver lower returns. Covered calls implemented to deliver higher derivative income should be expected to have (1) lower total returns, (2) higher tax realizations along the path, and (3) a more negatively skewed return profile. Investors who allocate to these strategies for their income alone, without accounting for these other considerations, might have made a devil’s bargain.”
Negatively Skewed Distribution of Returns
Because the covered call strategy eliminates the upside potential, it produces negative skewness of returns (the kind investors dislike). And while it is true that a covered call strategy reduces kurtosis (fat tails), the problem is that it eliminates the potential for the good fat tail (the one to the right) while having no impact on the risk of occurrence of the bad fat tail (the one to the left), only reducing its size by the amount of the premiums collected. Risk-averse investors would much prefer it be the other way around—eliminating the risk of the left fat tail (bear market) while accepting a smaller right fat tail (bull market).
Performance of Covered Call ETFs
We now turn to examining the performance of the leading ETFs utilizing call writing strategies. We begin with examining the performance of the call writing ETF with the most assets under management (AUM), the Global X NASDAQ 100 Covered Call ETF (QYLD), with $7.5 billion in AUM and an expense ratio of 0.60%. We’ll compare its performance to that of the Invesco QQQ Trust ETF (QQQ), an index fund based on the Nasdaq 100. The period covered is from the inception of QYLD in January 2014 through September 2023. Data is from Portfolio Visualizer.
| Annualized Return (%) | Standard Deviation (%) | Sharpe Ratio | Largest Drawdown (%) | |
| QYLD | 6.4 | 11.8 | 0.49 | -22.7 |
| QQQ | 16.5 | 18.4 | 0.86 | -32.6 |
Over this period, which included two negative years for QQQ (-3.1% in 2018 and -19.1% in 2022), QYLD achieved its objective of lowering volatility (from 18.4% to 11.8%) and reducing the left tail risk (worst drawdown was -22.7% versus -32.6%), but it was much less efficient at delivering returns—the Sharpe ratio of QQQ (0.86) was 75% greater than that of QYLD (0.49). And the absolute reduction in annualized returns exceeded 10%. That’s quite a price to pay for the reduction in risk achieved, as QYLD’s return was 61% below that of QQQ, while its volatility was only 36% less.
Making the point that yield is not return, Morningstar showed that while QYLD’s yield was 12.3% as of November 1, 2023, over the prior three months the fund had lost 5.1%. An investor who bought the fund at the end of July 2023 would have taxable income but an unrealized loss (unless they sold their investment).
We’ll now analyze the performance of the second largest covered call writing ETF, the Global X S&P 500® Covered Call ETF (XYLD), with $2.8 billion in AUM and an expense ratio of 0.60%. We’ll compare its performance with that of the Vanguard S&P 500 ETF (VOO). The period covered is from the inception of XYLD in July 2013 through September 2023. Data is from Portfolio Visualizer.
| Annualized Return (%) | Standard Deviation (%) | Sharpe Ratio | Largest Drawdown (%) | |
| XYLD | 6.6 | 12.1 | 0.50 | -23.4 |
| VOO | 12.6 | 14.9 | 0.77 | -23.9 |
Over this period, which included two negative years for VOO (- 4.5% in 2018 and ‑18.2% in 2022), XYLD achieved its objective of lowering volatility (from 14.9% to 12.1%) and slightly reducing the left tail risk (worst drawdown was -23.4% versus -23.9%), but it was much less efficient at delivering returns—the Sharpe ratio of VOO (0.77) was 54% greater than that of QYLD (0.50). And the reduction in absolute returns was 6%. That’s quite a price to pay for the reduction in risk achieved, as XYLD’s return was 48% below that of VOO, while its volatility was only 19% less.
Making the point that yield is not return, Morningstar showed that while XYLD’s yield was 11.5% as of November 1, 2023, over the prior three months the fund had lost 5.0%. An investor who bought the fund at the end of July 2023 would have taxable income but an unrealized loss (unless they sold their investment).
Investor Takeaways
Israelov and Ndong’s findings demonstrated that at least some investors might be attracted to covered calls for the wrong reason, seeking income rather than equity and volatility risk premia. That attraction can lead to a misallocation to these risk premia versus a best-fit allocation when analyzed appropriately. They also demonstrated that these strategies might lead investors to have overly optimistic return assumptions guided by their derivative yield. Considering the yield as income could also lead investors to make misinformed choices in terms of spending.
The live returns of the two most popular covered call writing ETFs should cause investors to question the prudence of these strategies, which are also less tax-efficient than traditional long-only strategies.
The most important takeaway is that the call premium is not income. This is the same type of mistake investors make about dividends, leading many to overvalue them. By definition, income increases wealth. Dividends do not do that; when a dividend is paid, their investment is now worth less (by the amount of the dividend). In other words, a dividend is just a forced divestment of some of your investment—you are receiving cash but now have a lower equity allocation. It’s also not income, except for tax purposes, which makes dividend payments an inefficient way to return capital to shareholders. In both cases, the failure to understand this can lead to overallocation to “income” strategies.
Larry Swedroe is the author or co-author of 18 books on investing, including his latest Enrich Your Future.
For informational and educational purposes only and should not be construed as specific investment, accounting, legal, or tax advice. Certain information is based on third party data and may become outdated or otherwise superseded without notice. Third party information is deemed to be reliable, but its accuracy and completeness cannot be guaranteed. The mentions of specific securities should not be construed as a recommendation or an overall picture of a portfolio. Individuals should speak with a qualified financial professional. The Securities and Exchange Commission (SEC) nor any other federal or state agency has approved, determined the accuracy, or confirmed the adequacy of this article. LSR-23-576
About the Author: Larry Swedroe
—
Important Disclosures
For informational and educational purposes only and should not be construed as specific investment, accounting, legal, or tax advice. Certain information is deemed to be reliable, but its accuracy and completeness cannot be guaranteed. Third party information may become outdated or otherwise superseded without notice. Neither the Securities and Exchange Commission (SEC) nor any other federal or state agency has approved, determined the accuracy, or confirmed the adequacy of this article.
The views and opinions expressed herein are those of the author and do not necessarily reflect the views of Alpha Architect, its affiliates or its employees. Our full disclosures are available here. Definitions of common statistics used in our analysis are available here (towards the bottom).
Join thousands of other readers and subscribe to our blog.