In our book, “The Incredible Shrinking Alpha,” Andrew Berkin and I identified four key trends that were increasing the hurdles for active managers in their quest to generate alpha:
- Academic research has been converting what was once alpha into beta (common factors that could be accessed at much lower costs through systematic funds such as index funds).
- The pool of victims (naive retail investors) who can be exploited has been shrinking.
- The competition has been getting tougher (today’s active managers are much more skillful and thus harder to exploit).
- The supply of dollars chasing alpha has increased (the amount of dollars in hedge funds increased from about $300 billion 25 years ago to about $5 trillion today.
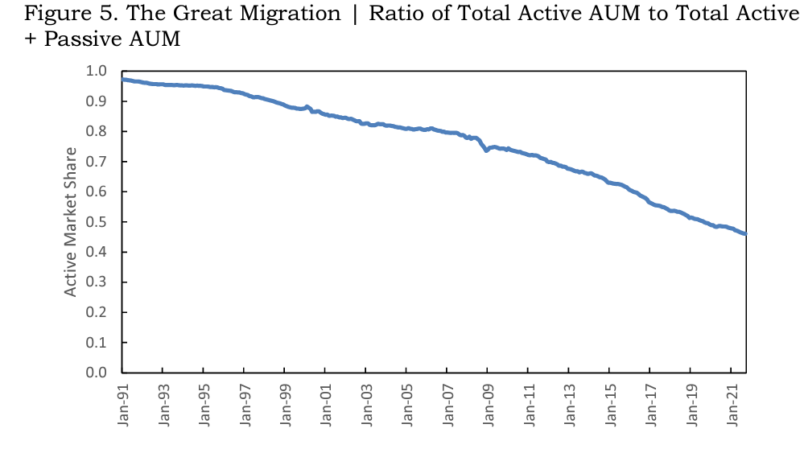
The publication of the poor performance of actively managed funds (as shown in the annual SPIVA reports) has led U.S. active funds to experience net outflows since 2006. The percentage of total assets under management (AUM) in active mutual funds has been in steady decline, dropping to 46% as of September 2021.

James Xiong, Thomas Idzorek, and Roger Ibbotson, authors of the study “The Diminishing Role of Active Mutual Funds: Flows and Returns,” published in the fourth quarter 2023 issue of the Journal of Investment Management, analyzed how inflows and outflows impacted the ability of active funds to generate alpha. They began by noting that the literature had found that flow-induced trading can cause significant price pressure. (Flow-driven trades are forced trades that require funds to demand liquidity, creating market impact costs). The authors explained: “This flow-driven return effect can fully account for fund performance persistence and partially explain stock price momentum.” They added: “ETF flows exhibit a statistically significant and cross-sectionally consistent positive association with contemporaneous underlying index returns, supporting the flow-driven return effect.”
Xiong, Idzorek, and Ibbotson also noted that the authors of the 2022 study “In Search of the Origins of Financial Fluctuations: The Inelastic Markets Hypothesis” found that flows in and out of the stock market have large impacts on prices when the price elasticity of demand of the aggregate stock market is small; and the rise of passive investing has led to a reduction in price elasticity. Finally, they noted that “since flows also chase outperforming funds, positive (negative) returns can result in future inflows (outflows). The flow-driven return effect is more on the relation between contemporaneous flows and returns, instead of returns and future flows.”
Their data sample included 4,638 active domestic mutual funds, 350 index mutual funds, and 528 passive exchange-traded funds (ETFs) and covered the period from January 1991 to September 2021.
Following is a summary of their findings:
- The number of funds peaked at 2,313 as of December 2006 and then shrunk to 1,618 as of September 2021—the decrease in funds was arguably attributed to the persistent fund outflows post-2006.
- The cumulative net outflows for active mutual funds were $2.2 trillion from January 2006 to September 2021.
- Net outflows in active mutual funds were largely offset by net inflows into ETFs.
- The AUM-weighted performance remained similar over time, but equal-weighted performance (which emphasizes small AUM active funds) deteriorated.
- Decreases in expense ratios did not seem to meaningfully improve net returns and did not halt the net outflow trend.
- Inflows/outflows contributed to the over/underperformance of individual active funds—a fund experiencing high inflows (outflows) could boost (hurt) its performance due to flow impact, which has nothing to do with skills.
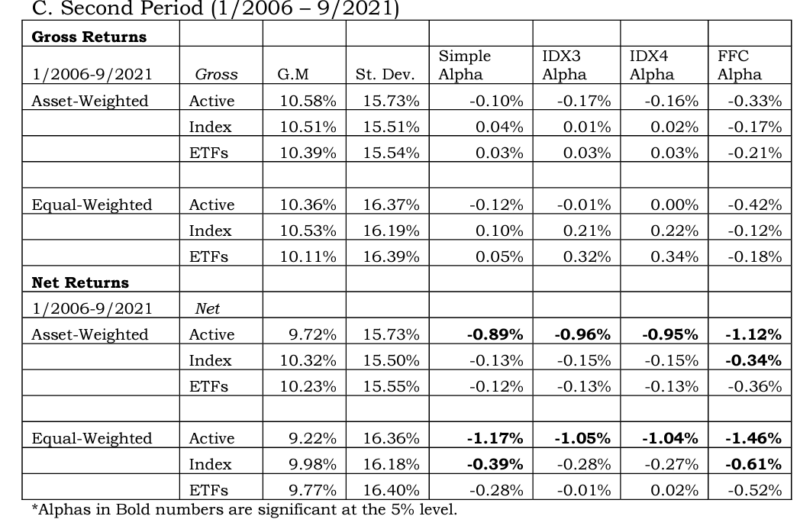
- The flow impact on annualized alpha for the aggregated active funds industry was 0.33% between January 1991 and December 2005, but it was -0.10% between January 2006 and September 2021—the negative flow trend had impacted the performance for the active fund industry by -0.43% over the last 30 years.
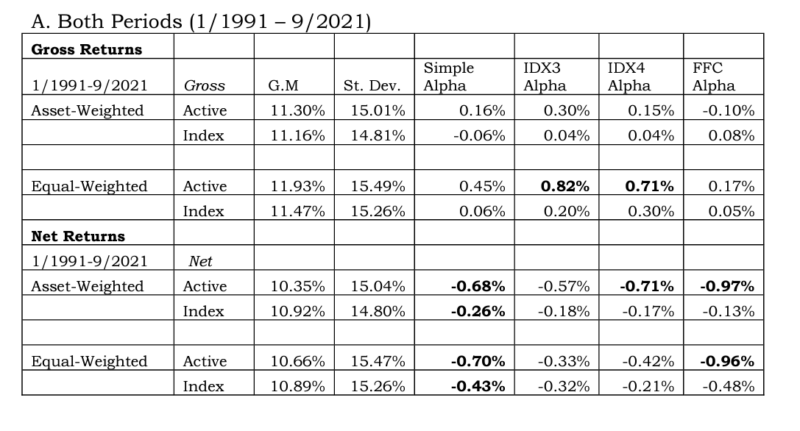
- Net alphas were negative on asset-weighted and equal-weighted measures. And they deteriorated over the period.


The results are hypothetical results and are NOT an indicator of future results and do NOT represent returns that any investor actually attained. Indexes are unmanaged and do not reflect management or trading fees, and one cannot invest directly in an index
- Expense ratios (about 70 basis points higher for active funds) largely explained the differences between gross and net returns for both active and index funds.
- Smaller AUM active funds tended to outperform larger AUM active funds in the first period but not the second.
- With net returns, the number of inferior funds (9.55%) was about the same as the number of superior funds (9.39%) in the first period. However, the number of inferior funds (17.25%) was much greater than the number of superior funds (1.74%) in the second period—it was more difficult to select a superior active mutual fund in the more recent period.
- If the current flow trend continues, the AUM of active mutual funds will drop to 17% of the total AUM of equity funds after 15 years.
Their findings led the authors to conclude that “inflows lift performance and outflows drag down performance.”
Investor Takeaways
While the evidence clarifies that active management is a loser’s game (one that is possible to win but so unlikely you should not try), we don’t want active managers to disappear. Hope should continue to triumph over evidence, wisdom, and experience because active managers help eliminate market anomalies and inefficiencies created by the misbehavior of investors (such as noise traders). That helps to ensure that capital is allocated efficiently.
The diminishing market share of active mutual funds relative to passive funds might suggest that the market could become less efficient and thus create opportunities for active managers. However, the evidence demonstrates that the reverse has been the case for the reasons presented in “The Incredible Shrinking Alpha” and the additional insights provided by the paper reviewed above.
Larry Swedroe is the author or co-author of 18 books on investing, including his latest Enrich Your Future.
For informational and educational purposes only and should not be construed as specific investment, accounting, legal, or tax advice. Certain information is deemed to be reliable, but its accuracy and completeness cannot be guaranteed. Third party information may become outdated or otherwise superseded without notice. Neither the Securities and Exchange Commission (SEC) nor any other federal or state agency have approved, determined the accuracy, or confirmed the adequacy of this article. LSR-23-588
About the Author: Larry Swedroe
—
Important Disclosures
For informational and educational purposes only and should not be construed as specific investment, accounting, legal, or tax advice. Certain information is deemed to be reliable, but its accuracy and completeness cannot be guaranteed. Third party information may become outdated or otherwise superseded without notice. Neither the Securities and Exchange Commission (SEC) nor any other federal or state agency has approved, determined the accuracy, or confirmed the adequacy of this article.
The views and opinions expressed herein are those of the author and do not necessarily reflect the views of Alpha Architect, its affiliates or its employees. Our full disclosures are available here. Definitions of common statistics used in our analysis are available here (towards the bottom).
Join thousands of other readers and subscribe to our blog.

