The justification for neutralizing sectors in factor strategies is a work in progress. To date, academic researchers haven’t had an empirical model to mimic the impact of removing sector “effects” on the measurement and performance of factor strategies. The authors develop and test a two-component model to address the question of, “Is Sector Neutrality in Factor Investing a Mistake?”
Is Sector Neutrality in Factor Investing a Mistake?
- Sina Ehsani, Campbell R. Harvey & Feifei Li
- Financial Analysts Journal
- A version of this paper can be found here
- Want to read our summaries of academic finance papers? Check out our Academic Research Insight category.
What are the research questions?
Using their model, the authors confirm that the stock-specific component of a firm’s characteristics contains more information than the sector component of the same characteristics. Therefore, if an individual factor exposure is neutralized, the information contained in the factor signal may be degraded. Certainly, such a conclusion produces significant consequences that accompany even simple methods of neutralization. Here is the basis of the argument presented and empirically tested in the paper:
”….assume that signal S consists of two parts, S=W+A. If S is the book-to-market ratio, and W is its within-sector component, then A is the across-sector component. The investor can use the signal as it stands and earn a return of S * r = (W + A) * r, or they can use W or A independently to earn W * r or A * r. If W predicts returns more accurately than A, then the risk–return profile of W * r dominates that of A * r. Should the mean-variance investor form portfolios based on W or (W + A?) This problem, the value of predictor A in the presence of W, is equivalent to a static two risky-asset problem. “
The authors show that the weaker predictor can be identified by the ratio of the Sharpe Ratios of portfolio A and portfolio W, magnified by the correlation between the 2 portfolios. If the Sharpe Ratio of portfolio A is lower than that of W, then it should be ignored as redundant. The tradeoff between information content and diversification benefits is highlighted. Two portfolios are formed. The first portfolio (W) is based on size, value, profitability, momentum, or investment with equal, rank, and market value-weighted schemes. The second (A) uses the same factors and weighting schemes but only after subtracting the industry average.
- Should factor strategies be sector-neutralized?
What are Academic Insights?
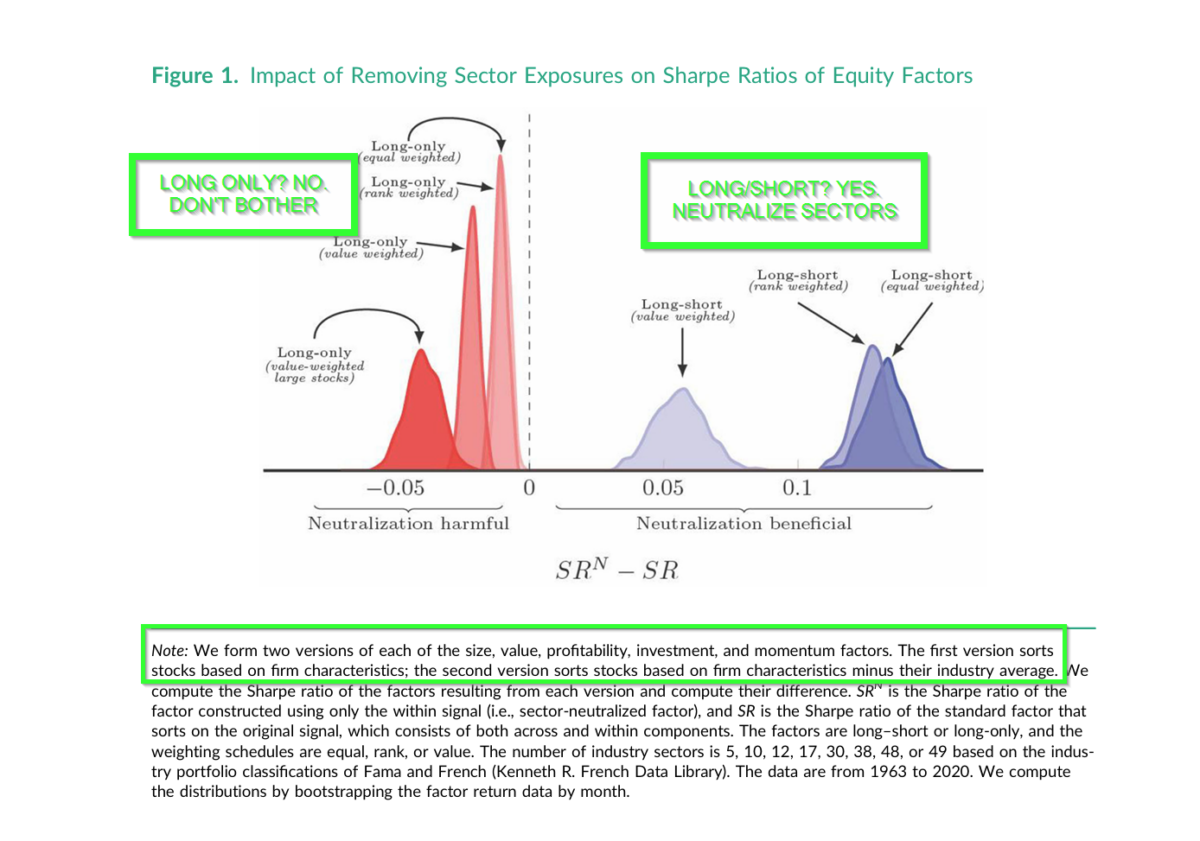
- IT DEPENDS. First, examine Figure 1. Whether or not sector neutrality should be implemented primarily depends on the portfolio construction method. This result is consistent with the literature and the analysis provides supporting empirical evidence. For long/short strategies, retaining the sector/industry component produces a better result 20% of the time, while making the adjustment boosts that value to 78%. The long/short investor benefits from sector neutralization beyond the reduction in diversification of a rising correlation. The Sharpe ratios for the A and W groups are very similar for long-only factor strategies. There is little to no benefit to adjusting for sector/industry exposures. Making a sector adjustment reduces the Sharpe Ratio. Interestingly, the largest reduction occurred in value-weighted, large-cap strategies. The long–short investor can expand the mean-variance boundary considerably more by investing in sector-neutral factors than not. The decision to adjust is driven by the construction method. Other issues, such as multiple factors, the number of sectors included, or the type of factor, make little to no contribution to the question.
Why does it matter?
There are valid reasons for neutralizing sectors for some factors simply on the face of it. Utilities and financial firms come to mind due to the characteristics of those firms that bias the measures of value, for instance. Here, the authors present a simple framework assuming two sources of return predictability: across (A) the sector and within (W) the sector. Should both be used? The answer depends on the relationship and correlation of the Sharpe Ratios of the two portfolios. The model produces testable hypotheses with significant practical applications. For the investor engaged in active management, the changing nature of Sharpe Ratios and correlations is a practical concern. The model presented here provides a guiding metric as to the expected value of neutralization for factor portfolios. Next up: regional or country exposures.
The most important chart from the paper
The results are hypothetical results and are NOT an indicator of future results and do NOT represent returns that any investor actually attained. Indexes are unmanaged and do not reflect management or trading fees, and one cannot invest directly in an index.
Abstract
Stock characteristics have two sources of predictive power. First, a characteristic might be valuable in identifying high or low expected returns across industries. Second, a characteristic might be useful in identifying individual stock expected returns within an industry. Past studies generally find that the firm specific component is the strongest predictor, leading many to sector neutralize their factor exposures. We show both analytically and empirically that the average long benefit from hedging out sector bets, whereas the long-only investor should, on average, avoid sector neutralization.
About the Author: Tommi Johnsen, PhD
—
Important Disclosures
For informational and educational purposes only and should not be construed as specific investment, accounting, legal, or tax advice. Certain information is deemed to be reliable, but its accuracy and completeness cannot be guaranteed. Third party information may become outdated or otherwise superseded without notice. Neither the Securities and Exchange Commission (SEC) nor any other federal or state agency has approved, determined the accuracy, or confirmed the adequacy of this article.
The views and opinions expressed herein are those of the author and do not necessarily reflect the views of Alpha Architect, its affiliates or its employees. Our full disclosures are available here. Definitions of common statistics used in our analysis are available here (towards the bottom).
Join thousands of other readers and subscribe to our blog.