Perhaps the most well-documented and researched asset pricing anomaly is momentum—the tendency of past winner stocks to outperform past loser stocks over the next several months. While average time-series momentum (trend following) returns have been high, strategies employing trend following have also experienced huge drawdowns (crashes) at turning points (which mark reversals in trend from uptrend to downtrend or vice versa). These turning points have been called momentum’s “Achilles heel.” For example, the authors of the 2022 study “Isolating Momentum Crashes” found that from
“June to August 1932 the momentum portfolio lost about 91%, followed by a second draw-down in April to July 1933. Another prominent crash took place in 2009 when momentum lost more than 73% within three months. In addition to that, there have been several smaller crashes in 1938/1939, 1974/1975, and 2001/2002. While being smaller in size, each of those comprised at least one monthly loss of more than 19%. Therefore, high monthly returns of 1.15% come with a large kurtosis [fat tail] of 16.6 and a highly negative skewness of -2.3.”
They added: “Remarkably, crashes are driven by large gains of previous losers while winners still exhibit modestly positive returns.”
The good news is that researchers have uncovered strategies that have reduced crash risk—crashes are at least partly forecastable, tending to occur in “panic” states following market declines and when market volatility is high, and are contemporaneous with market rebounds. The authors of the 2015 study “Momentum Has Its Moments,” the 2016 study “Momentum Crashes,” the 2017 study “A Century of Evidence on Trend-Following Investing,” the 2018 study “The Impact of Volatility Targeting,” the 2019 study “Portfolio Management of Commodity Trading Advisors with Volatility Targeting,” and the 2020 studies “Conditional Volatility Targeting” and “Understanding Volatility-Managed Portfolios” have found:
- Long-only momentum strategies are not subject to deep crashes.
- Scaling momentum based on momentum’s mean and variance dramatically reduces the risk of crashes and greatly improves the Sharpe ratio of momentum strategies.
- Scaling strategies could be improved upon by adjusting risk exposures conditional on (extreme) volatility states—it reduces risk exposures during high volatility states, increases risk exposures during low volatility states, and maintains an unscaled exposure otherwise.
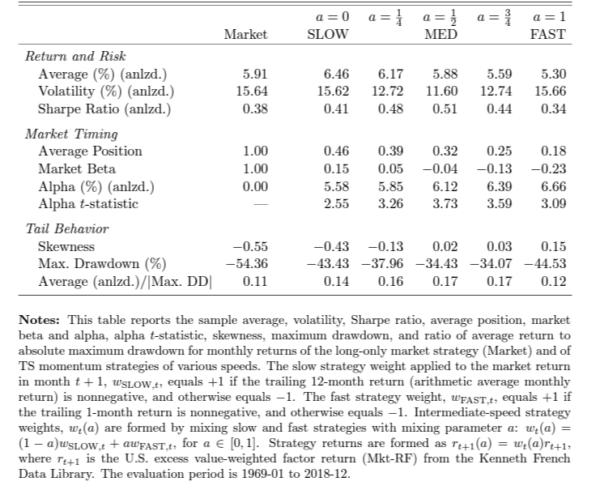
In their May 2023 study “Momentum Turning Points,” Christian Goulding, Campbell Harvey, and Michele Mazzoleni found that momentum strategies could be improved on by dynamically blending slow and fast momentum strategies based on four-state cycle-conditional information. They partitioned an asset’s return history into four observable phases—Bull, Correction, Bear, and Rebound—by relying on the agreement or disagreement of slow and fast trailing momentum signals. They then examined the information content of these states for subsequent return behavior. They used this information to specify an implementable “dynamic” trend-following strategy that adjusts the weight it assigns to slow (such as 12 months) and fast (such as one month) momentum signals after observing market breaks (Corrections or Rebounds). If historical returns tended to be positive after Corrections (when the slow strategy goes long and the fast strategy goes short), then the strategy would tilt away (scale down) from the fast strategy. In contrast, if historical returns tended to be positive after Rebounds (when the slow strategy goes short and the fast strategy goes long), then the strategy would tilt toward the fast strategy. If historical returns were negative after such states, then the direction of the tilt reversed.
Among their key findings were:
- When bets indicated by SLOW and FAST disagreed, the market was more likely to be at a turning point.
- The agreement of SLOW and FAST to go long (short) was more likely to indicate the market was amid an uptrend (downtrend).
- Intermediate-speed momentum strategies had higher Sharpe ratios than the average Sharpe ratios of SLOW or FAST. They also further reduced exposure to extreme downside events by scaling down after Corrections and Rebounds. They linked this behavior to the volatility of returns following turning-point states.
The results are hypothetical results and are NOT an indicator of future results and do NOT represent returns that any investor actually attained. Indexes are unmanaged and do not reflect management or trading fees, and one cannot invest directly in an index.
- The Sharpe ratio of the dynamic-speed strategy was higher than the highest static-speed strategy for most countries.
- State-dependent speed analysis elected slower-speed momentum after Correction months and faster-speed momentum after Rebound months.
Their findings led Goulding, Harvey, and Mazzoleni to conclude:
“We find relatively high persistence and high noise, properties that make the union of information in slow and fast momentum signals relevant for detecting trends and momentum turning points.”
They added:
“Intermediate-speed strategies, formed by blending slow and fast TS momentum, vary the exposure to the good bets associated with uptrend (Bull) or downtrend (Bear) phases and the bad bets associated with turning points (Correction or Rebound). For the U.S. stock market, we find that intermediate-speed strategies empirically exhibit many advantages over slow and fast strategies, including higher Sharpe ratios, less severe drawdowns, more positive skewness, and higher significance of alphas.”
They also found that despite being simple in construction, the four market states (Bull, Bear, Correction, and Rebound) possessed predictive information for stock market returns and had close connections to the macroeconomy and the business cycle.
Latest Research
Goulding, Harvey, and Mazzoleni built on their prior work in their February 2024 study “Breaking Bad Trends” in which they expanded their analysis from the U.S. equity market to include monthly returns for 43 futures markets across three major asset classes (11 equity indices, eight bond markets, and 24 commodities). Their data began in January 1980 for some of the assets. For all others, they added an asset into the analysis when its return data became available. Their evaluations focused on the period 1990-2022 for which they had enough returns data to compute 12-month trend-following strategies for at least four assets in each asset class. Their time series of returns was based on holding the front-month contract, then swapping into a new front contract as the expiration date of the held contract approached. As in their earlier paper, they partitioned an asset’s return history into four observable phases—Bull, Correction, Bear, and Rebound—by relying on the agreement or disagreement of slow and fast trailing momentum signals. They then examined the information content of these states for subsequent return behavior. They used this to specify an implementable “dynamic” trend-following strategy that adjusted the weight it assigned to slow (12 months) and fast (two months) momentum signals after observing market breaks (Corrections or Rebounds). Following is a summary of their key findings:
- Across different asset classes, there was a negative relationship between the number of turning points an asset experienced and the risk-adjusted performance of its 12-month trend-following strategy.
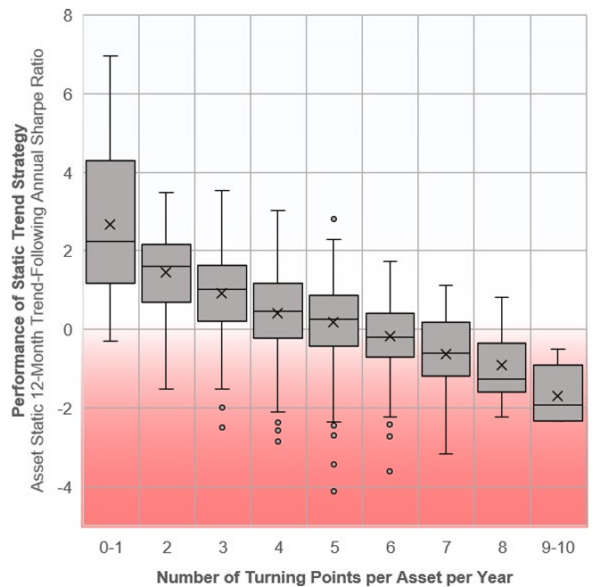
Notes: For each asset in each calendar year, we calculate the number of turning points as the frequency of months within the year for which the signs of its trailing 12-month and 1-month returns differ. Static 12-month trend goes long one unit if the asset’s trailing 12-month return is positive; otherwise, it goes short one unit. We calculate an asset’s trend-following Sharpe ratio each year as an asset’s annual excess return from trend following divided by an asset’s annualized realized monthly volatility of trend following. There are 1,258 asset-year observations in total, none of which has 11 or 12 turning points in any year. The horizontal lines of each box plot indicate the 25th percentile, median, and 75th percentile, respectively. The height of the box reflects the interquartile range (IQR). The mean is indicated by ×. The whiskers extend up from the top of the box to the largest data point ≤ 1.5 times the IQR and down from the bottom of the box to the smallest data point > 1.5 times the IQR. We consider values outside this range as outliers, represented by dots.
The results are hypothetical results and are NOT an indicator of future results and do NOT represent returns that any investor actually attained. Indexes are unmanaged and do not reflect management or trading fees, and one cannot invest directly in an index.
- For a multi-asset trend-following portfolio normalized to 10% annualized volatility over the 33-year period 1990–2022, a one-standard-deviation increase in the average number of breaking points per year (+0.47) was associated with a decrease of about 8.9 percentage points in its annual portfolio return.
- Turning-point frequency and return volatility were virtually uncorrelated. In addition, volatility exhibited no significant relationship with risk-adjusted trend-following performance.
- The number of breaking points helped explain the deterioration of trend-following performance in the expansion period (2009-2019) following the global financial crisis of 2007-09. During this 11-year expansion period, the average number of turning points experienced across assets increased: nine of these years were at or above the median number of turning points in their 33-year sample period. An increase in turning points means a decrease in sustained periods of trend—the market phases in which trend following is most effective.
- Turning points (the observed difference between shorter and longer lookback horizons) could be predictive of subsequent returns and used to improve the profitability of trend-following strategies across asset classes by using a strategy of dynamically reacting to turning points (as demonstrated in their “Momentum Turning Points” paper).
- Dynamic trend generated 3.4% average returns, well above the 0.3% generated by a static 12-month trend. And nearly half of the dynamic gains were from returns harvested after turning points.
Their findings led Goulding, Harvey, and Mazzoleni to conclude: “Our framework supports dynamic blending of two time-series momentum strategies having slow and fast momentum signals.”
Investor Takeaways
The empirical research demonstrates that, on average, investing in previous winners and short-selling previous losers has offered significant returns that cannot be explained by other common risk factors. But momentum has also displayed significant tail risk, as there were short but persistent periods of highly negative returns. Crashes occurred particularly in reversals from bear markets when the momentum portfolio displayed a negative market beta and momentum volatility was high. Fortunately, the empirical evidence has found that crashes were at least partially predictable and that the predictability and thus the performance of momentum strategies can be improved by employing systematic strategies.
In their two papers, Goulding, Harvey, and Mazzoleni showed that observed market corrections and rebounds carry predictive information about subsequent returns and showed how that information could be utilized to enhance the performance of trend-following strategies by dynamically blending slow and fast momentum strategies based on four-state cycle-conditional information.
Larry Swedroe is the author or co-author of 18 books on investing, including his latest Enrich Your Future.
For informational and educational purposes only and should not be construed as specific investment, accounting, legal, or tax advice. Certain information is based on third party data and may become outdated or otherwise superseded without notice. Third-party information is deemed reliable, but its accuracy and completeness cannot be guaranteed. Neither the Securities and Exchange Commission (SEC) nor any other federal or state agency have approved, determined the accuracy, or confirmed the adequacy of this article. The opinions expressed in this article are those of the author and may not accurately reflect those of Buckingham Wealth Partners. LSR-23-628
About the Author: Larry Swedroe
—
Important Disclosures
For informational and educational purposes only and should not be construed as specific investment, accounting, legal, or tax advice. Certain information is deemed to be reliable, but its accuracy and completeness cannot be guaranteed. Third party information may become outdated or otherwise superseded without notice. Neither the Securities and Exchange Commission (SEC) nor any other federal or state agency has approved, determined the accuracy, or confirmed the adequacy of this article.
The views and opinions expressed herein are those of the author and do not necessarily reflect the views of Alpha Architect, its affiliates or its employees. Our full disclosures are available here. Definitions of common statistics used in our analysis are available here (towards the bottom).
Join thousands of other readers and subscribe to our blog.