The important role played by short sellers, who, through their actions, keep prices efficient by preventing overpricing and the formation of price bubbles in financial markets, has received increasing academic attention in recent years. Research into the information contained in short-selling activity— for example the 2023 study, “Swim with Sharks: Are Short Sellers More Informed than their Competitors?”—has consistently found that short sellers are informed investors who are skilled at processing information (though they tend to be too pessimistic). That is evidenced by the findings that both stocks exhibiting a higher aggregate short interest ratio in the current month, compared to their counterparts, tend to experience relatively lower future returns and stocks with high shorting fees earn abnormally low returns even after accounting for the shorting fees earned from securities lending (loan fees provide information in the cross-section of equity returns).
Fund families that invest systematically, such as AQR, Avantis, Bridgeway, and Dimensional, have found ways to incorporate the research findings to improve returns over those of a pure index replication strategy. For example, a long-only fund could screen out from their eligible universe stocks with high short interest and/or shorting fees. This will likely become increasingly important as the markets have become less liquid, increasing the limits to arbitrage and allowing for more overpricing.
Increasing Limits to Arbitrage and Greater Risk of Shorting
Xavier Gabaix and Ralph Koijen demonstrated in their 2021 study, “In Search of the Origins of Financial Fluctuations: The Inelastic Markets Hypothesis,” markets have become less liquid and thus more inelastic. Gabaix and Koijen estimated that $1 in cash flows results in an increase of $5 in valuations. One explanation for the reduced liquidity is the increased market share of indexing and passive investing in general. Reduced liquidity increases the risks of shorting.
Adding further to the risks is the now-demonstrated ability of retail investors to “gang up” against shorts (who might be right in the long term but dead before they reach it). The first GameStop episode (January 2021) in which retail investors banded together to engineer a short squeeze (which drove the price of the stock up almost 30 times) demonstrated just how risky shorting can be, with the potential for unlimited losses. A repeat short squeeze occurred in May 2024 with short sellers losing more than $2.2 billion as the stock rose 60% on the 13th and another 120% in premarket trading on the 14th. The result is that the limits to arbitrage have now increased, allowing for more overpricing of “high sentiment” stocks, making the market less efficient.
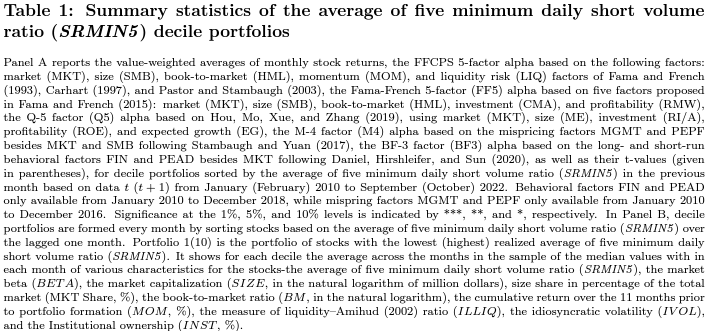
An interesting question is: What happens when the informed short sellers don’t short? Yifeng Zhu sought the answer to that question in his January 2024 study “When Short Sellers Do Not Short…” He introduced a metric for extremely low short volume for individual stocks based on the daily short volume of the month, denoted as SRMIN (the minimum daily short volume ratio) and SRMIN5 (the average of the five minimum daily short volume ratios for each stock in the month). Zhu collected public news data from Ravenpack, aggregated it on a daily level, and employed daily Fama-MacBeth regressions. He utilized short volume ratios as dependent variables and positive and negative news from the current and previous day as independent variables. He controlled for current and previous daily returns, realized firm size, book-to-market ratio, momentum, turnover ratio, illiquidity, and beta. His data sample covered the period January 2010 to October 2022. The dataset included all common stocks listed on the NYSE, AMEX, and NASDAQ, with a prerequisite of non-missing market capitalization. He also limited his analysis to stocks commencing the month with prices of $5 or more. Following is a summary of his key findings:
- An increase in positive public news corresponded to a decrease in current and future short sales. On the other hand, the effect of negative news was insignificant.
- The daily short volume for each stock was indicative of future returns specifically when it is at a low level.
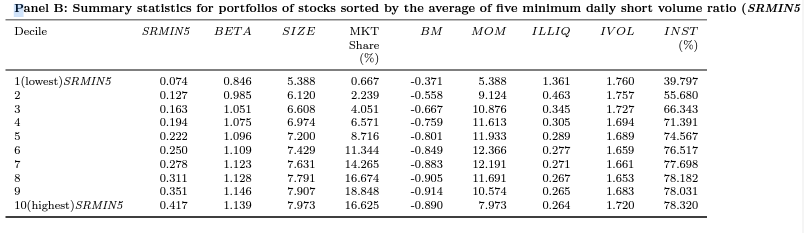
- Stocks with higher SRMIN tended to exhibit higher values for beta, market share, liquidity, institutional ownership, larger market capitalization, and a lower book-to-market ratio.
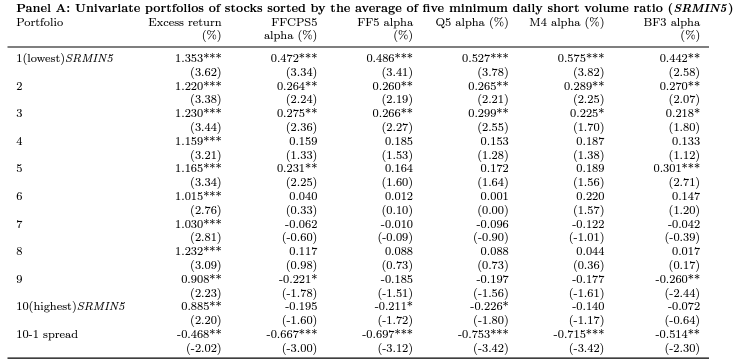
- Stocks characterized by lower SRMIN5 were associated with higher expected returns—expected returns decreased as SRMIN5 increased.
- The monthly value-weighted average excess return difference between portfolios in the lowest- and highest-SRMIN5 deciles was 0.468% or 5.16% per annum. Similar results were found when using quintiles.
- The value-weighted return difference between the highest and lowest SRMIN5 portfolios (quintiles 5 and 1) during the two months after portfolio formation was -0.343% per month, remained statistically significant at the 5% level with a t-statistic of-2.05. However, the predictive power of SRMIN5 on future returns diminished as time progressed away from the portfolio formation—generally, the return difference becomes statistically insignificant three months after the portfolio formation month.
- The return difference could not be explained by risk factor models—the return difference alpha even increased when controlling for common factors such as market (MKT), size (SMB), book-to-market (HML), momentum (MOM), and liquidity (LIQ) factors.
- Despite the time-varying nature of the return difference, it was remarkably stable. The extremely low (high) short-sale demand implied higher (lower) expected returns, and it was the extreme values, rather than average and/or aggregate short volume, that predicted stock returns.
- The minimum short volume reflects instances where investors obtain positive information and avoid shorting.
- The extreme short-sale demand in the current month predicted returns for up to four months with no reversal.
The results are hypothetical results and are NOT an indicator of future results and do NOT represent returns that any investor actually attained. Indexes are unmanaged, do not reflect management or trading fees, and one cannot invest directly in an index.
However, Zhu also found that for the largest 20% of firms, or the most liquid 20% of firms, the alphas associated with the return difference became statistically insignificant.
His findings led Zhu to conclude:
“Stocks with low short volume levels typically coincide with positive public news about future returns. However, investors may underreact to this positive information due to illiquidity, contributing to the significant return difference observed between portfolios with SRMIN5 for at least two months.”
He added: “Only the five days when short sellers do not short carry informative value for future stock returns.” This is the main new finding from his research.
Investor takeaways
Zhu’s findings demonstrated that extremely low short positions come from positive public news, while negative news can drive average short or extremely high short positions. Consistent with the behavioral finance and momentum literature, his findings suggest that investors underreact to such news due to illiquidity contributing to the return pattern he found. Another key takeaway with implications for portfolio construction is that it is the minimum short volume that holds significance for expected returns. It will be interesting to see if investment firms incorporate these new findings.
Larry Swedroe is the author or co-author of 18 books on investing, including his latest, Enrich Your Future: The Keys to Successful Investing.

About the Author: Larry Swedroe
—
Important Disclosures
For informational and educational purposes only and should not be construed as specific investment, accounting, legal, or tax advice. Certain information is deemed to be reliable, but its accuracy and completeness cannot be guaranteed. Third party information may become outdated or otherwise superseded without notice. Neither the Securities and Exchange Commission (SEC) nor any other federal or state agency has approved, determined the accuracy, or confirmed the adequacy of this article.
The views and opinions expressed herein are those of the author and do not necessarily reflect the views of Alpha Architect, its affiliates or its employees. Our full disclosures are available here. Definitions of common statistics used in our analysis are available here (towards the bottom).
Join thousands of other readers and subscribe to our blog.